Course Outline
-
segmentGetting Started (Don't Skip This Part)
-
segmentStatistics and Data Science: A Modeling Approach
-
segmentPART I: EXPLORING VARIATION
-
segmentChapter 1 - Welcome to Statistics: A Modeling Approach
-
segmentChapter 2 - Understanding Data
-
segmentChapter 3 - Examining Distributions
-
segmentChapter 4 - Explaining Variation
-
4.7 Sources of Variation
-
segmentPART II: MODELING VARIATION
-
segmentChapter 5 - A Simple Model
-
segmentChapter 6 - Quantifying Error
-
segmentChapter 7 - Adding an Explanatory Variable to the Model
-
segmentChapter 8 - Models with a Quantitative Explanatory Variable
-
segmentPART III: EVALUATING MODELS
-
segmentChapter 9 - The Logic of Inference
-
segmentChapter 10 - Model Comparison with F
-
segmentChapter 11 - Parameter Estimation and Confidence Intervals
-
segmentPART IV: MULTIVARIATE MODELS
-
segmentChapter 12 - Introduction to Multivariate Models
-
segmentChapter 13 - Multivariate Model Comparisons
-
segmentFinishing Up (Don't Skip This Part!)
-
segmentResources
list College / Advanced Statistics and Data Science (ABCD)
4.7 Sources of Variation
This is a good time to think a little more about where variation in data comes from. We already have talked about the DGP—the process that generates variation in the population from which we collected our sample of data. But the DGP includes a lot of different components that, working together, produce the variation we see in an outcome variable. What are these sources of variation?
There are three important points we want to make about sources of variation. First, variation can be either explained or unexplained.
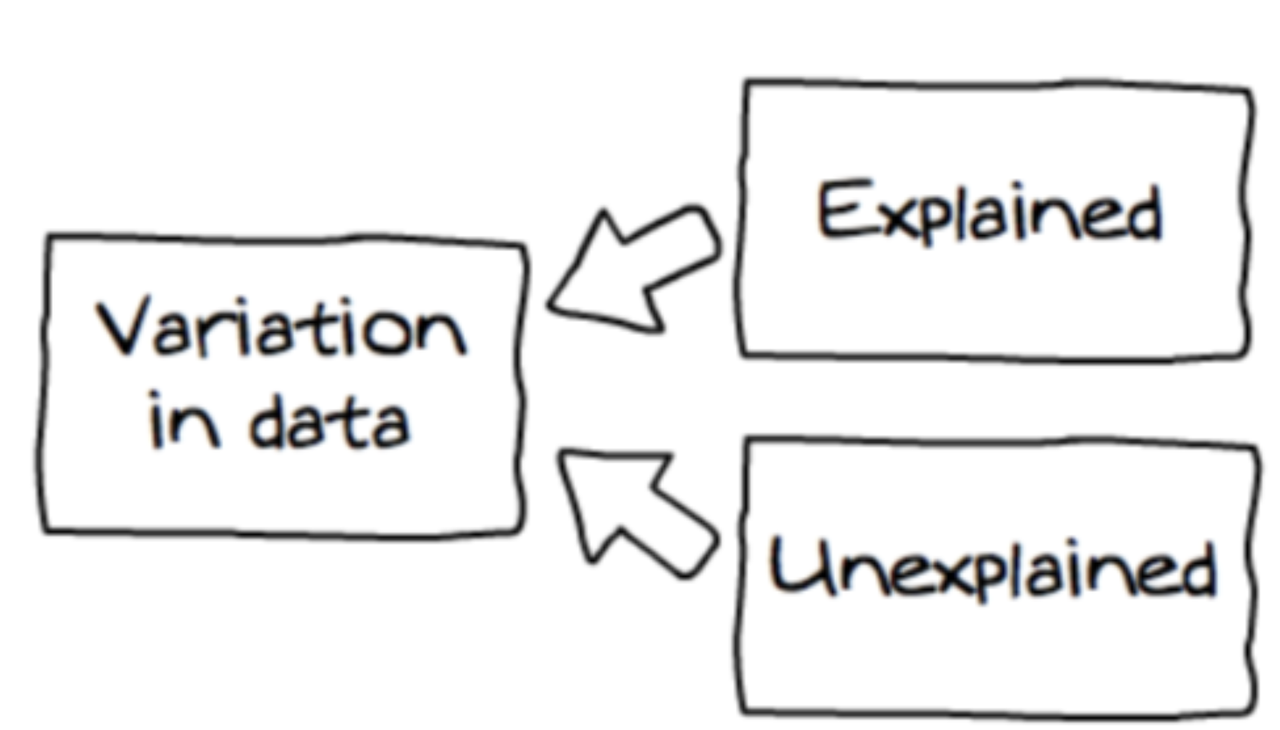
In the word equation we presented before, THUMB = SEX + OTHER STUFF, explained variation is the portion of the total variation we were able to attribute to sex. Unexplained variation is everything included in the “other stuff” part of the equation. It’s useful to think of total variation as the sum of explained + unexplained variation.
Second, unexplained variation can be a real characteristic of the system we are studying, or it can be variation that is induced by our data collection procedures.
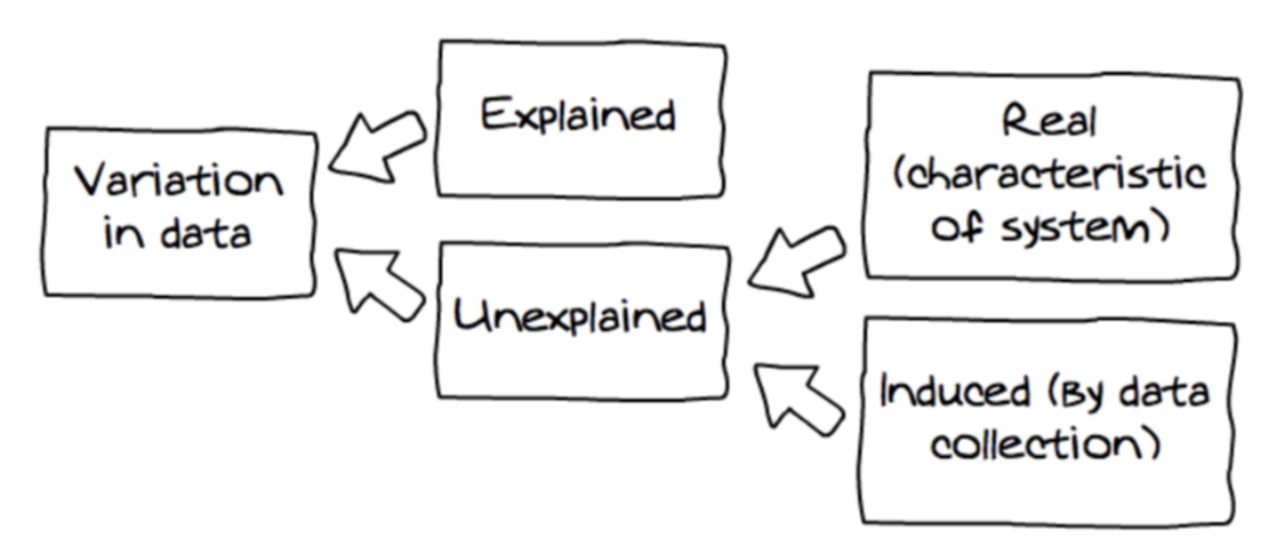
If the variation is real, that means we can probably figure out how to explain it if we measure the right explanatory variables; this variation could be thought of as not explained yet.
Variation induced by data collection comes in three buckets: measurement error (e.g., the small random variation that creeps into our measures); sampling error (i.e., the variation that occurs from sample to sample due to the fact that no individual sample is a perfect representation of the population); and mistakes (e.g., that some students had measured their thumbs in centimeters instead of millimeters).
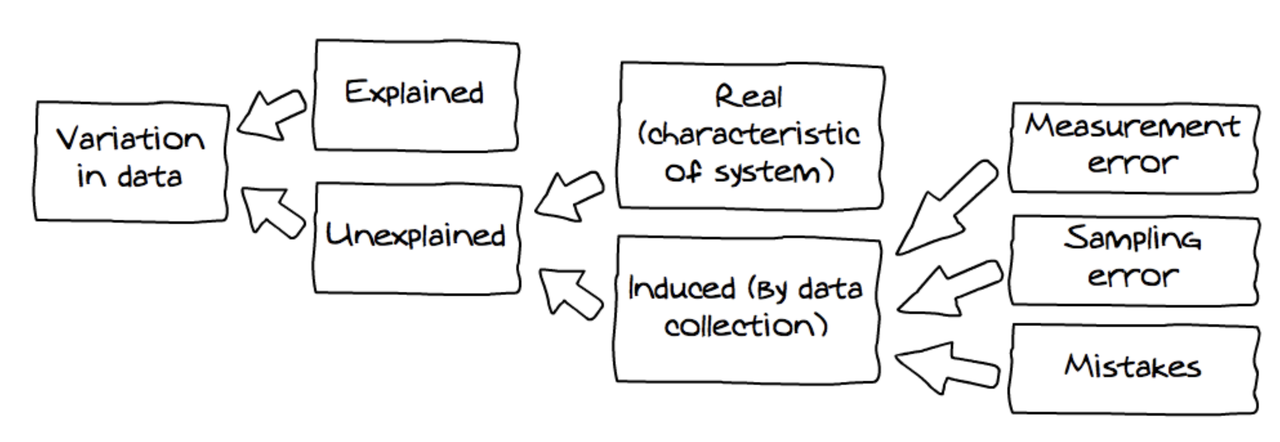
All sources of variation in data are represented in the diagram above (which we have adapted from Wild, 2006).
The third and final point we want to make is this: even though unexplained variation could be explained if we knew enough, statisticians tend to model unexplained variation, whether real or induced by data collection, as though it were generated by a random process. Let’s delve into this idea more in the next section.