8.10 Limitations to Keep in Mind
Regression and correlation are powerful tools for modeling relationships between variables. But each must be used thoughtfully, always interpreting the findings in context and using all the other knowledge you have about the context.
Correlation Does Not Imply Causation
Most important to bear in mind is that correlation does not imply causation, something you no doubt have heard before. Just the fact that two variables are correlated does not necessarily mean we understand something true about the DGP. And in this sense, regression is no different from correlation.
There are many examples of this. In Chapter 4 we mentioned a few: children’s shoe size is correlated with scores on an achievement test; the tendency to wear skimpy clothing is correlated with higher temperatures. In the case of shoe size, we can see that the correlation is spurious; age is a confound, causing increases in both shoe size and achievement. In the case of skimpy clothing, the relationship is real, but the causal direction must be sensibly interpreted. Hiking up the temperature might indeed cause people to shed their clothing. But taking off clothes is not going to cause the temperatures to go up, no matter how many times you try.
Correlation. (n.d.). Retrieved from https://xkcd.com/552/
Also, thumb length measured in millimeters is going to be perfectly correlated with thumb length measured in centimeters. The points will be perfectly laid out on a straight line. But does spotting this relationship get us any closer to understanding the DGP that produces variation in thumb length? Of course not.
Disambiguating causal relationships and controlling for possible confounds is not achievable through statistical analysis alone. Statistics can help, and correlation can certainly suggest that there might be causation there. But research design is a necessary tool. Random assignment of equivalent objects to conditions that do and don’t receive some treatment is often required to figure out whether a particular relationship is causal or not.
Are All Lines Straight?
Another thing to point out is that the models we have considered in this chapter are linear models. We fit a straight line to a scatter of points, and then look to see how well it fits by measuring residuals around the regression line.
But sometimes a straight line is just not going to be a very good model of the relationship between two variables.
Take this graph from a study of the relationship of body weight to risk of death (from McGee DL, 2005, Ann Epidemiol 15:87 and Adams KF, 2006, N Engl J Med 355:763). Being underweight and being overweight both increase the risk of death, whereas being in the middle reduces that risk.
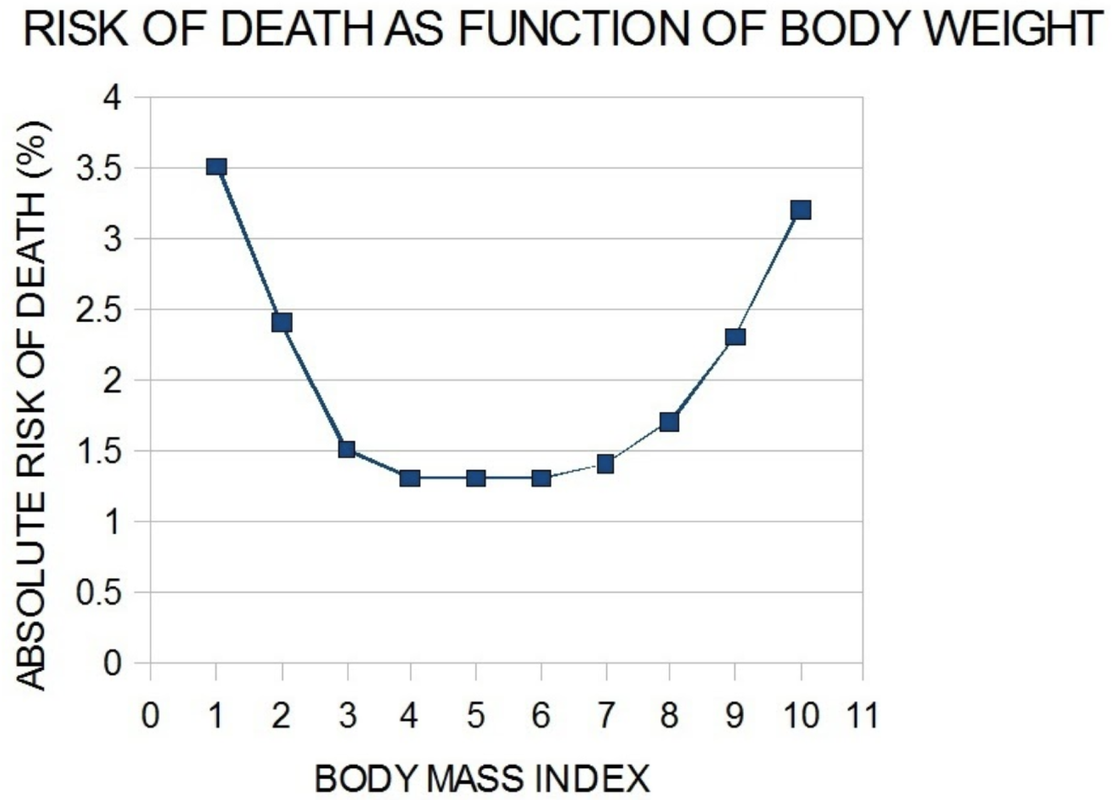
If you ignored the shape of the relationship and overlaid a regression line, the line would probably be close to flat, indicating no relationship. But if you did that you would be missing an important curvilinear relationship.
Before fitting a linear regression model, look at the relationship and see if one makes sense. If it doesn’t, think about a different model. Mathematicians have lots of models to offer beyond just the simple straight line.
Do Regression Lines Go On Forever?
Source of picture: (http://smbc-comics.com/comic/2011-08-05)
Finally, there is the problem of extrapolation. We have already pointed out from our regression of Thumb on Height that, according to the model, someone who is 0 inches tall would have a thumb length of -3.33 millimeters. Obviously, the regression model only works within a certain range, and it is risky to extend that range beyond where you have substantial amounts of data.
In general, common sense and a careful understanding of research methods must be applied to the interpretation of any statistical model.
End of Chapter Survey
Mid-Course Survey #2
You’re two-thirds through the book! Please tell us about your experience so far. (Estimated time: 5 minutes)