Chapter 1 - Welcome to Statistics, A Modeling Approach
1.1 Welcome to Statistics!
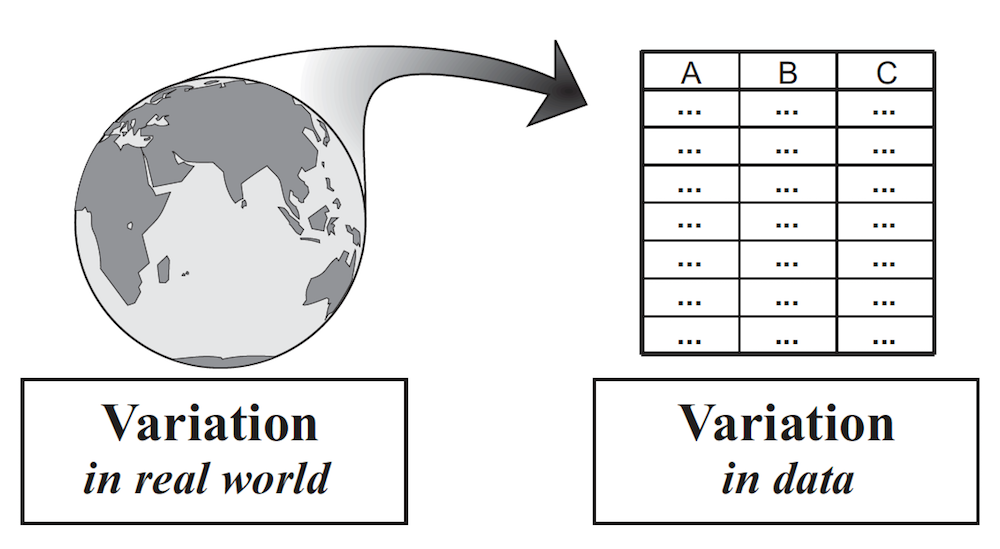
Welcome to Statistics and Data Science: A Modeling Approach. Statistics is the study of variation. It is the tools and concepts that have been developed, over centuries, to help us understand variation. There is a lot of variation in the world. As statisticians, we find ways to turn variation in the world into variation in data, and then analyze that data to deepen our understanding of the world. (See figure, from Wild, C. (2006). The concept of distribution. Statistics Education Research Journal, 5(2), 10-26.)
Learning statistics is hard. Even professional statisticians find it hard. They are always learning new things, and deepening their understanding. In this course, we want to get you started along the pathway to understanding. At the end of the course you will understand more than you do now, and hopefully that will be useful to you. But this course could be only the beginning. You can take it as far as you want.
And one more thing: even though learning statistics is hard, anyone can do it! Seriously, we have not found anyone who can’t understand the concepts in this course. If it feels hard, that just means you are making progress, not that you aren’t capable of getting there. Don’t forget this.
The Forest and the Trees
Most people have learned something about statistics before they take a course in it. Many of you have even taken whole courses in statistics before this one. If you have, you have probably heard about some or all of these things: mean, variance, standard deviation, t test, p, F, ANOVA, regression, chi-square, normal distribution, z score, and so on.
With such a long list, it’s no surprise that many students see remembering as the most challenging part of learning statistics. But actually, remembering is not the most challenging part. Understanding is the most challenging part. Even if you remember what all these things are, if you don’t understand how it all fits together you will probably forget it all as soon as you are done with the final exam. We don’t want that to happen!
We will discuss lots of these things you have heard of, or studied, before. But instead of emphasizing their particularity—how each is different from the other—we will work on understanding their coherence—how they are all connected together into a system of thinking. In other words, our goal is to help you see the forest, not the trees. The trees will come later, and more easily, if you have an overall framework for understanding where everything fits.

Elon Musk, the founder of Tesla and SpaceX, was asked on Reddit: “How do you learn so much so fast?” His answer was this:
One bit of advice: it is important to view knowledge as sort of a semantic tree—make sure you understand the fundamental principles, i.e. the trunk and big branches, before you get into the leaves/details or there is nothing for them to hang on to. [Source]
This is exactly what we are trying to give you: the trunk and big branches that you can hang other ideas on to. If you focus on the big ideas, it will help organize your knowledge and make it more flexible and powerful.
What Is Statistics?
We have said that statistics is the study of variation. And we want to focus on the forest, not the trees. But what is the forest when it comes to statistics? Or, using the Musk metaphor, what are the trunk and big branches?
We divide our course into three parts: exploring variation, modeling variation, and evaluating models. These are the three main goals statisticians have when analyzing data. Pretty much everything you need to know about statistics can be understood in relation to these three goals. Importantly, everything you learned about statistics before you took this course can also be understood in this framework.
The Statistical Model
The big idea that unites all of this together is the concept of statistical model. We don’t assume that you know what a statistical model is. Instead, we expect your understanding of this powerful idea to increase gradually throughout the course. Statistical models help us in three main ways.
First, they help us to understand patterns in data and where they come from, or, what we will call the Data Generating Process (or DGP for short). The DGP is the process that causes variation, which we will discuss a lot more later in the course.
Second, they help us to predict what will happen in the future. Of course we can’t really predict the future very well—we aren’t psychic, and you probably aren’t either. But, using statistical models, we can make better predictions than we could without them, even if they aren’t very good. Sometimes this is very useful. When Netflix recommends a movie you might like, they use a statistical model. They may be wrong, but they do better than just random guessing!
Finally, statistical models can help you improve the functioning of complex systems. In situations where everything seems to vary, and where the variation seems overwhelming, you can still use statistical models to help you identify changes you can make in one variable that will improve some outcome you are interested in. Some hospitals, for example, use statistical models to help reduce the time patients spend waiting to see a doctor.
Simple + Profound
Jordan Ellenberg in his book How Not to Be Wrong (Ellenberg, J. (2015). How not to be wrong: The power of mathematical thinking. Penguin) provides a nice description of where the content of his book will focus, which applies equally well to this course.
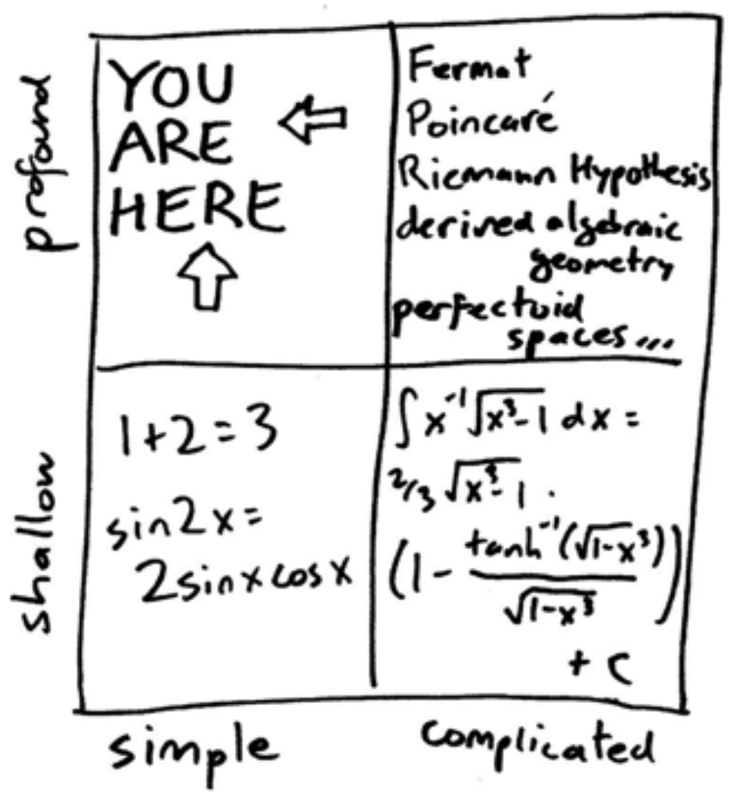
Math, he writes, can be organized along two dimensions (see figure from Ellenberg, above). First, there is simple math and complicated math. \(1+2=3\) is simple math, whereas this is more complicated:
\[f(x) = \int h(x)\, dx=g(x)\]
The other dimension is from shallow to profound. Although the previous two examples differ in terms of how complicated they are, both are relatively shallow in their import.
Professional mathematicians spend their time working on ideas that are complicated and profound (upper right quadrant of the table). But mathematical ideas that are profound do not have to be complicated. Some ideas are simple, yet profound.
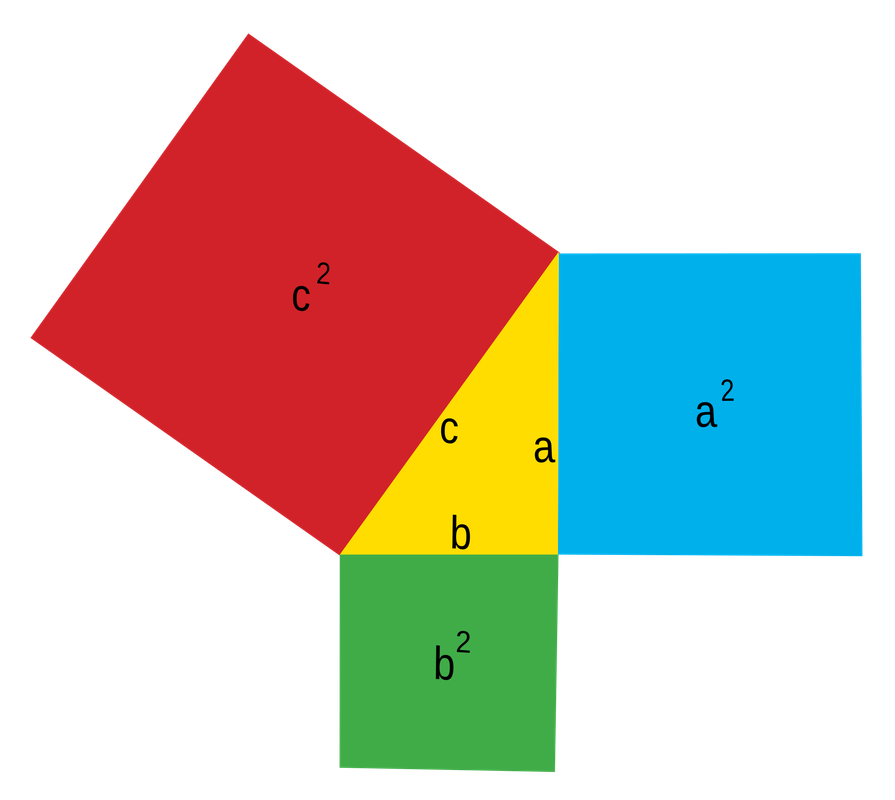
For example, the Pythagorean theorem, \(a^2 + b^2 = c^2\), is often taught in geometry courses to help students solve for one of the sides of a triangle. But there is a profoundness to the Pythagorean theorem that has nothing to do with solving for anything. If you take a right triangle, ANY right triangle, the area of squares created from the two smaller sides will equal the area of the square created from the hypotenuse.
Statistics, especially the statistics we will study in this course, falls in this quadrant—simple and profound. The ideas are actually pretty simple, especially when you look past the surface features to the big organizing concepts behind them. But they are powerful ideas that can make a profound difference in how you think about and analyze the world. This is our sweet spot.
In This Course, Thinking Is More Important Than Calculating
The mathematics behind basic statistics is simple (it’s mostly adding, subtracting, multiplying, and dividing a bunch of times). The computations are trivial, though labor intensive. That’s why statisticians, more than anyone, are so excited about the advent of modern computers. It means they don’t have to do repeated and boring calculations. In fact, if all you learn is how to calculate statistics, you really won’t know much.
Statistics is not about calculation. It is about thinking. The hard part of this course will not be understanding all the pieces—the calculations, the symbols, and so on—but understanding how all these pieces fit together. In short, you need to understand. Let’s pause to consider what it means to understand, and how you can get there.