9.4 Comparing Regression Models to Group Models
Comparing the Height2Group Model and the Height Model
We now know how to specify and fit two different kinds of models: group models (e.g., Height2Group_model) and regression models (Height_model), let’s just think for a bit on what the similarities and differences are between these models.
| Symbol |
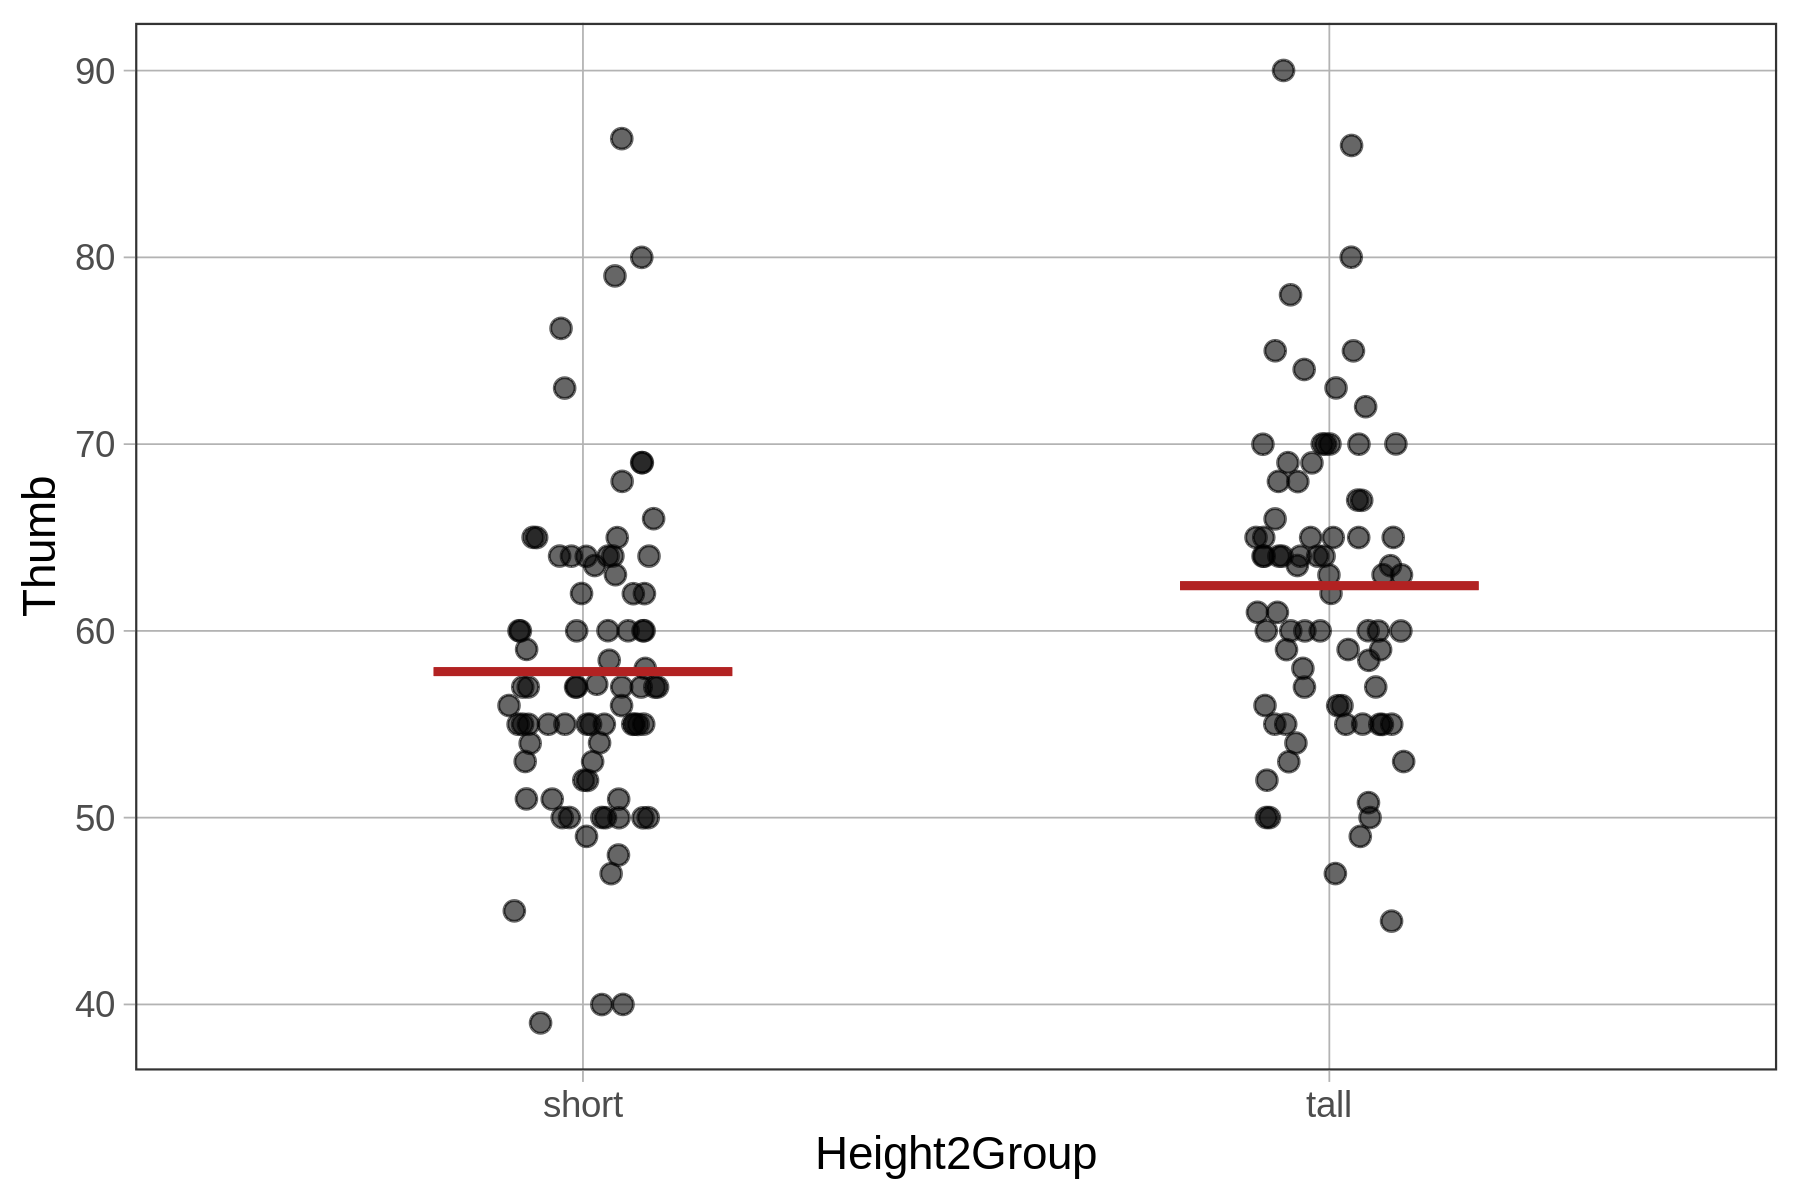
Group Model \({Thumb}_i=b_0+b_1{Height2Grouptall}_i+e_i\) |
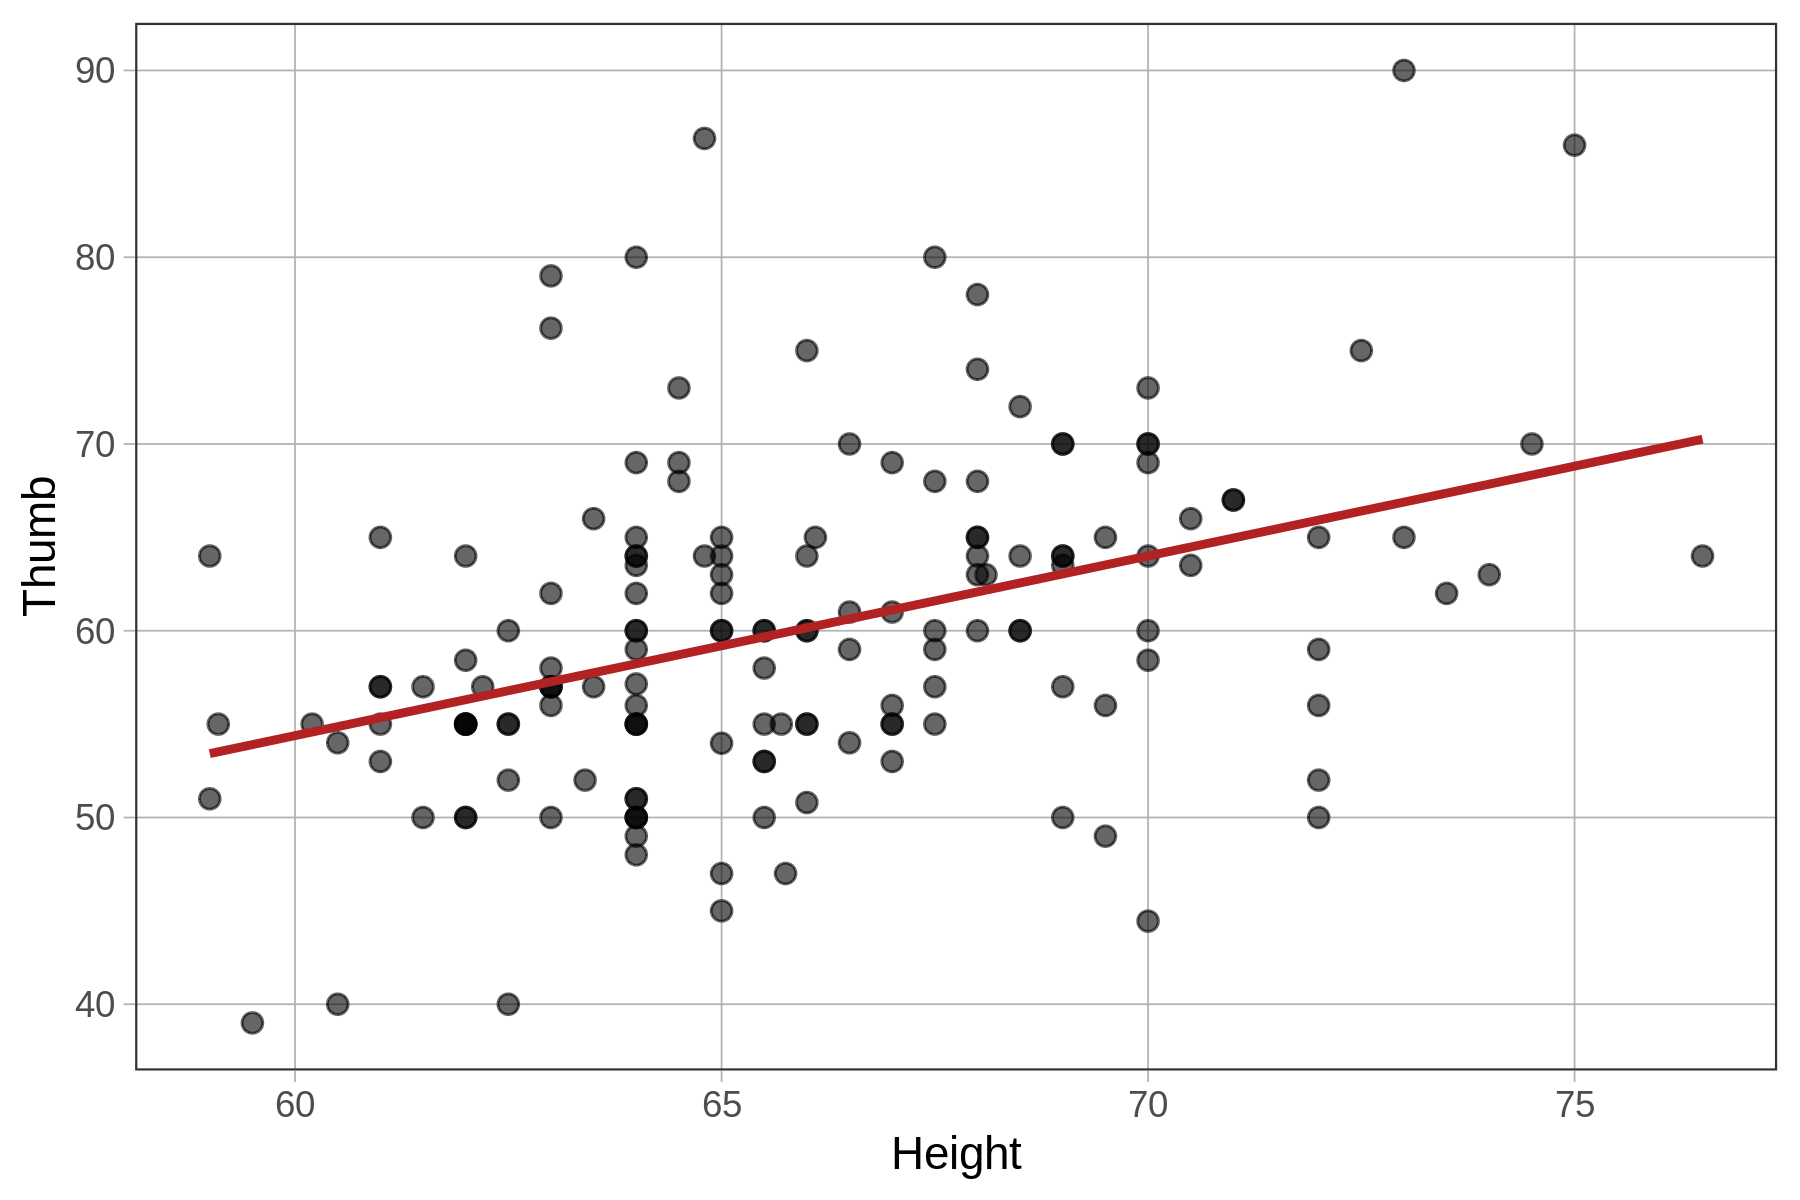
Regression Model \({Thumb}_i=b_0+b_1{Height}_i+e_i\) |
|---|---|---|
| \(Y_i\) | Thumb length of a student i | Thumb length of a student i |
| \(b_0\) |
Predicted thumb length when \(Height2Group_i = 0\)) (mean thumb length for short group) |
Predicted thumb length when \(Height_i=0\) (y-intercept for regression line) |
| \(b_1\) |
Adjustment to predicted thumb length for a tall student (the mean difference between the two group means) |
Adjustment to predicted thumb length for a one-unit increase in height (the slope of the regression line) |
| \(X_i\) | Height2Group of a student i, coded as 0=not-tall, 1=tall | Height of a student i in inches |
| \(e_i\) | Error for student i | Error for student i |
| visualization of the model |
|
|
Fitting a Regression Model By Accident When You Don’t Want One
Although R is pretty smart about knowing which model to fit, it won’t always do the right thing. If you code the grouping variable with character strings such as “female” and “male” or “short” and “tall,” R will make the right decision to fit a group model because it knows the variable must be categorical. But if you code the same grouping variable as 1 and 2 (maybe you forget to make it a factor), R may get confused and fit the model as though the explanatory variable is quantitative.
For example, we’ve added a new variable to our Fingers data called SexNum. Here is what the data look like.
 Thumb    Sex SexNum
1    66   male      2
2    64 female      1
3    56 female      1
4    70   male      2
5    52 female      1
6    62   male      2
If you take a look at the variables Sex and SexNum, they have the same information. Students 2, 3, and 5 are in one group and students 1, 4, and 6 are in another group. If we fit a model with Sex (and call it the Sex_model) or SexNum (and call it the SexNum_model), we would expect the same estimates. Let’s try it.
require(coursekata)

Fingers$SexNum <- as.numeric(Fingers$Sex)
# fit a model of Thumb length based on Sex
Sex_model <- lm()

# fit a model of Thumb length based on SexNum
SexNum_model <- lm()

# this prints the parameter estimates from the two models
Sex_model
SexNum_model
# fit a model of Thumb length based on Sex
Sex_model <- lm(Thumb ~ Sex, data=Fingers)

# fit a model of Thumb length based on SexNum
SexNum_model <- lm(Thumb ~ SexNum, data=Fingers)

# this prints the parameter estimates from the two models
Sex_model
SexNum_model
ex() %>% {
    check_object(., "Sex_model") %>% check_equal()
    check_object(., "SexNum_model") %>% check_equal()
    check_output_expr(., "Sex_model
SexNum_model")
}Call:
lm(formula = Thumb ~ Sex, data = Fingers)
Coefficients:
(Intercept) Sexmale
58.256 6.447 Call:
lm(formula = Thumb ~ SexNum, data = Fingers)
Coefficients:
(Intercept) SexNum
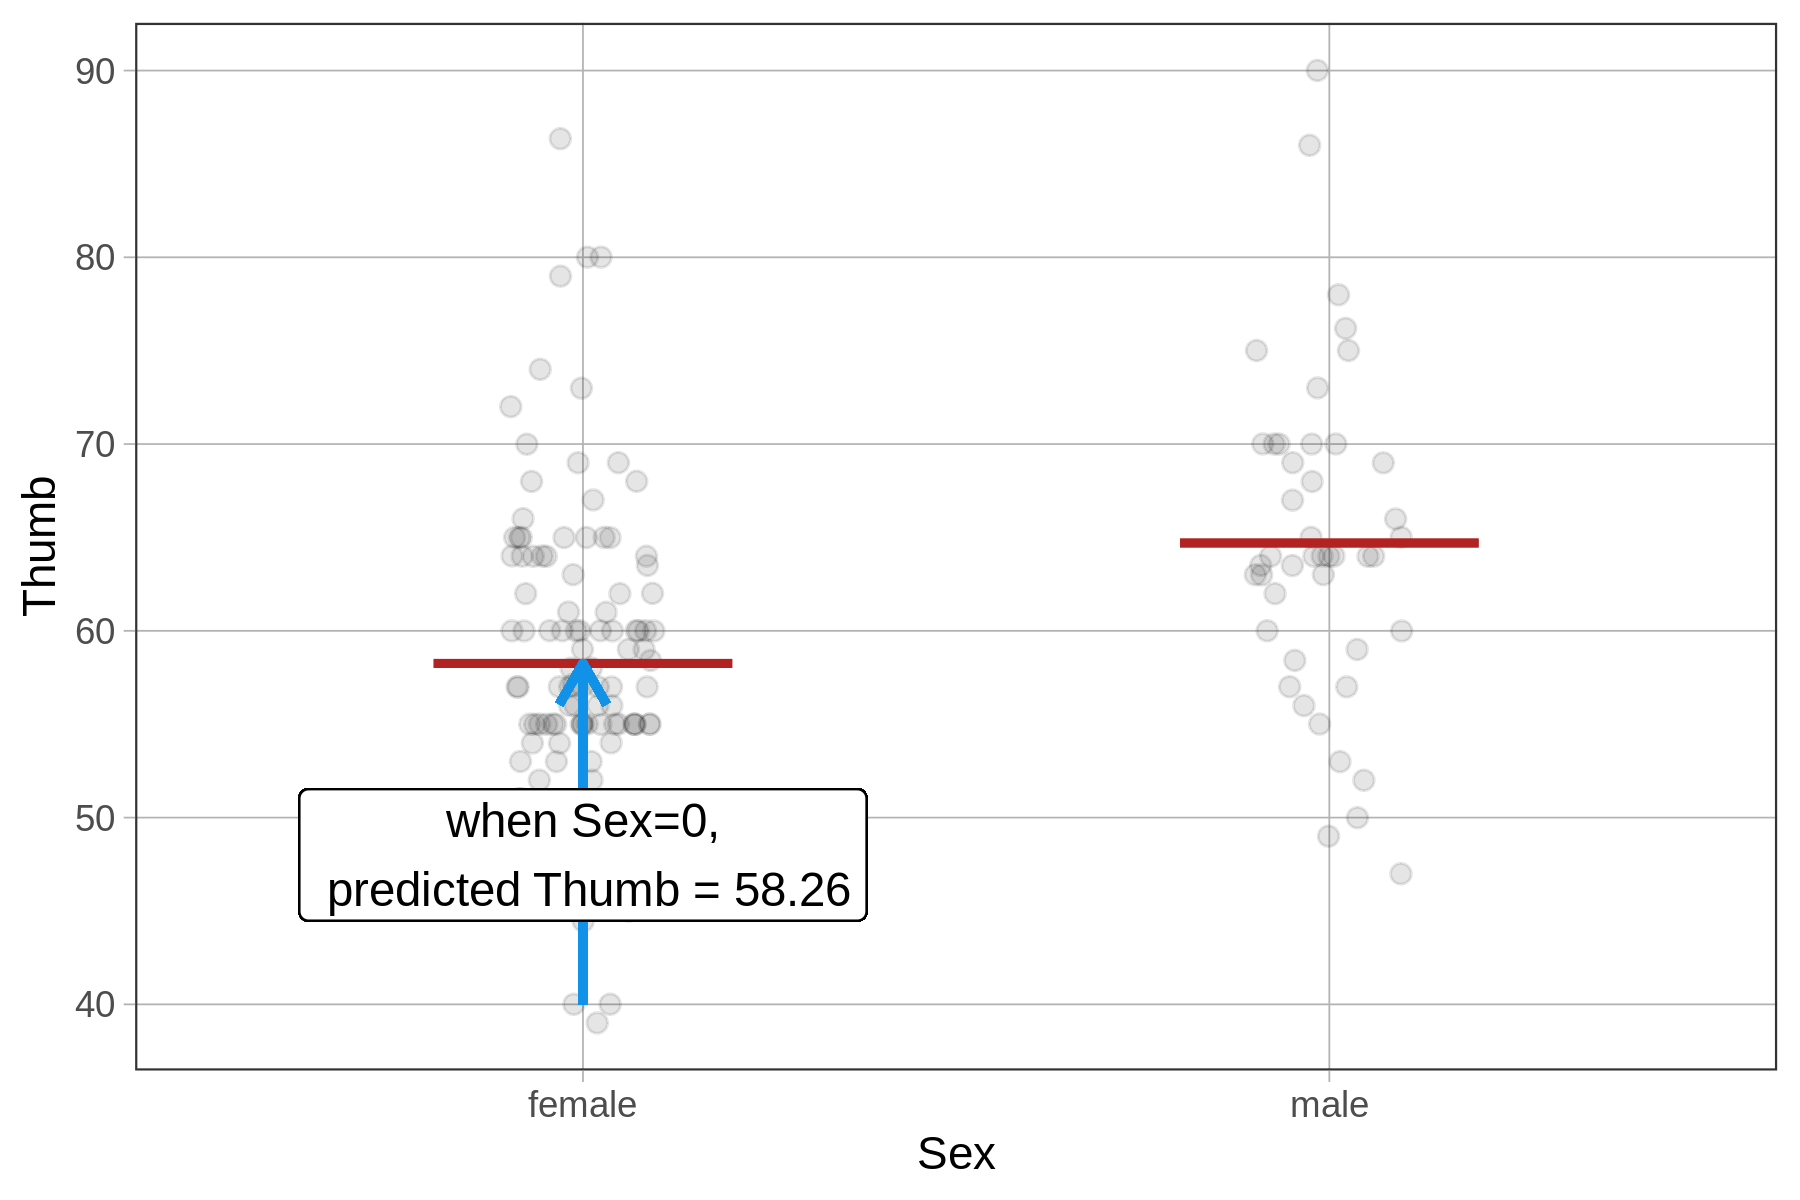
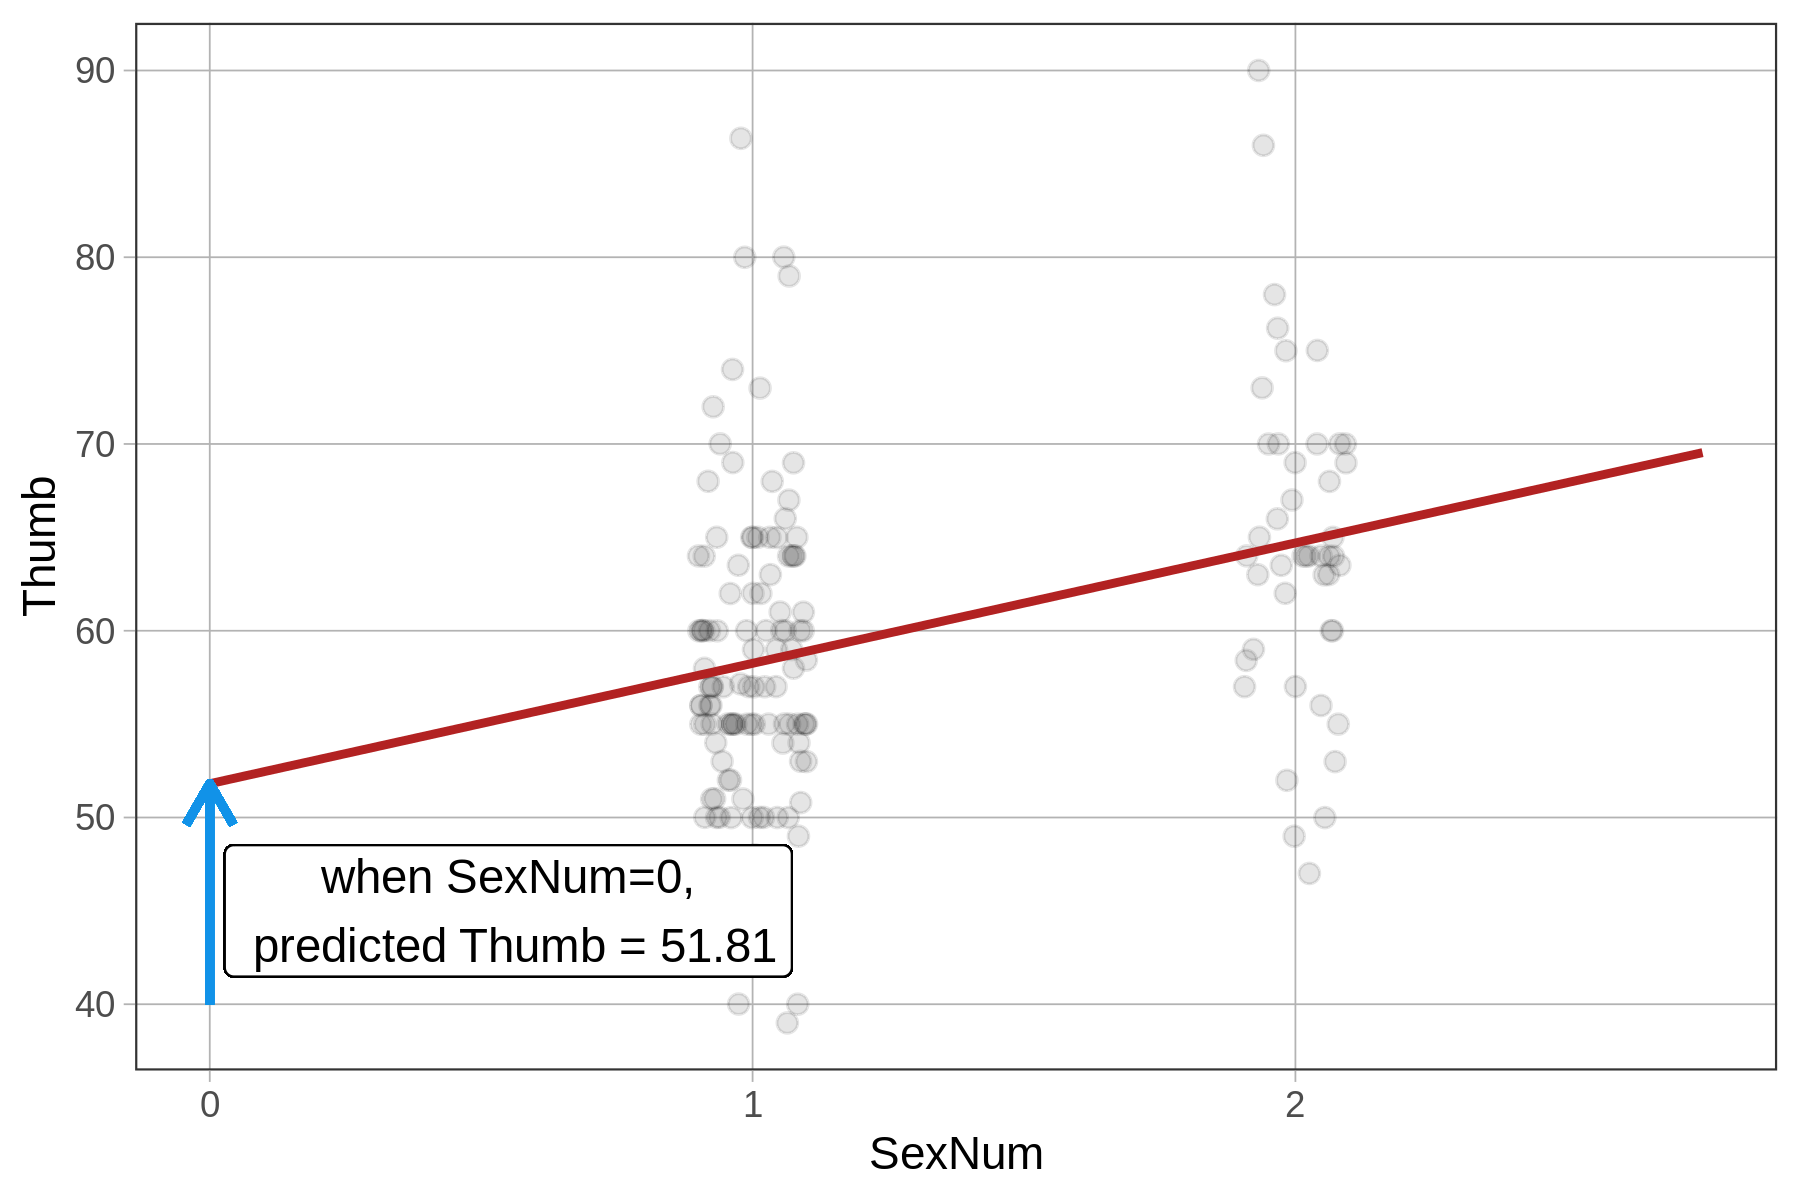
51.809 6.447 Because Sex is a factor (i.e., a categorical variable), lm() fits a group model. But for SexNum, lm() thinks the 1 or 2 coding refers to a quantitative variable. Because we did not tell R to treat SexNum as a factor, it fits a regression line instead of a two-group model. If it does that, the meaning of the estimates will not be what you expect for the group model.
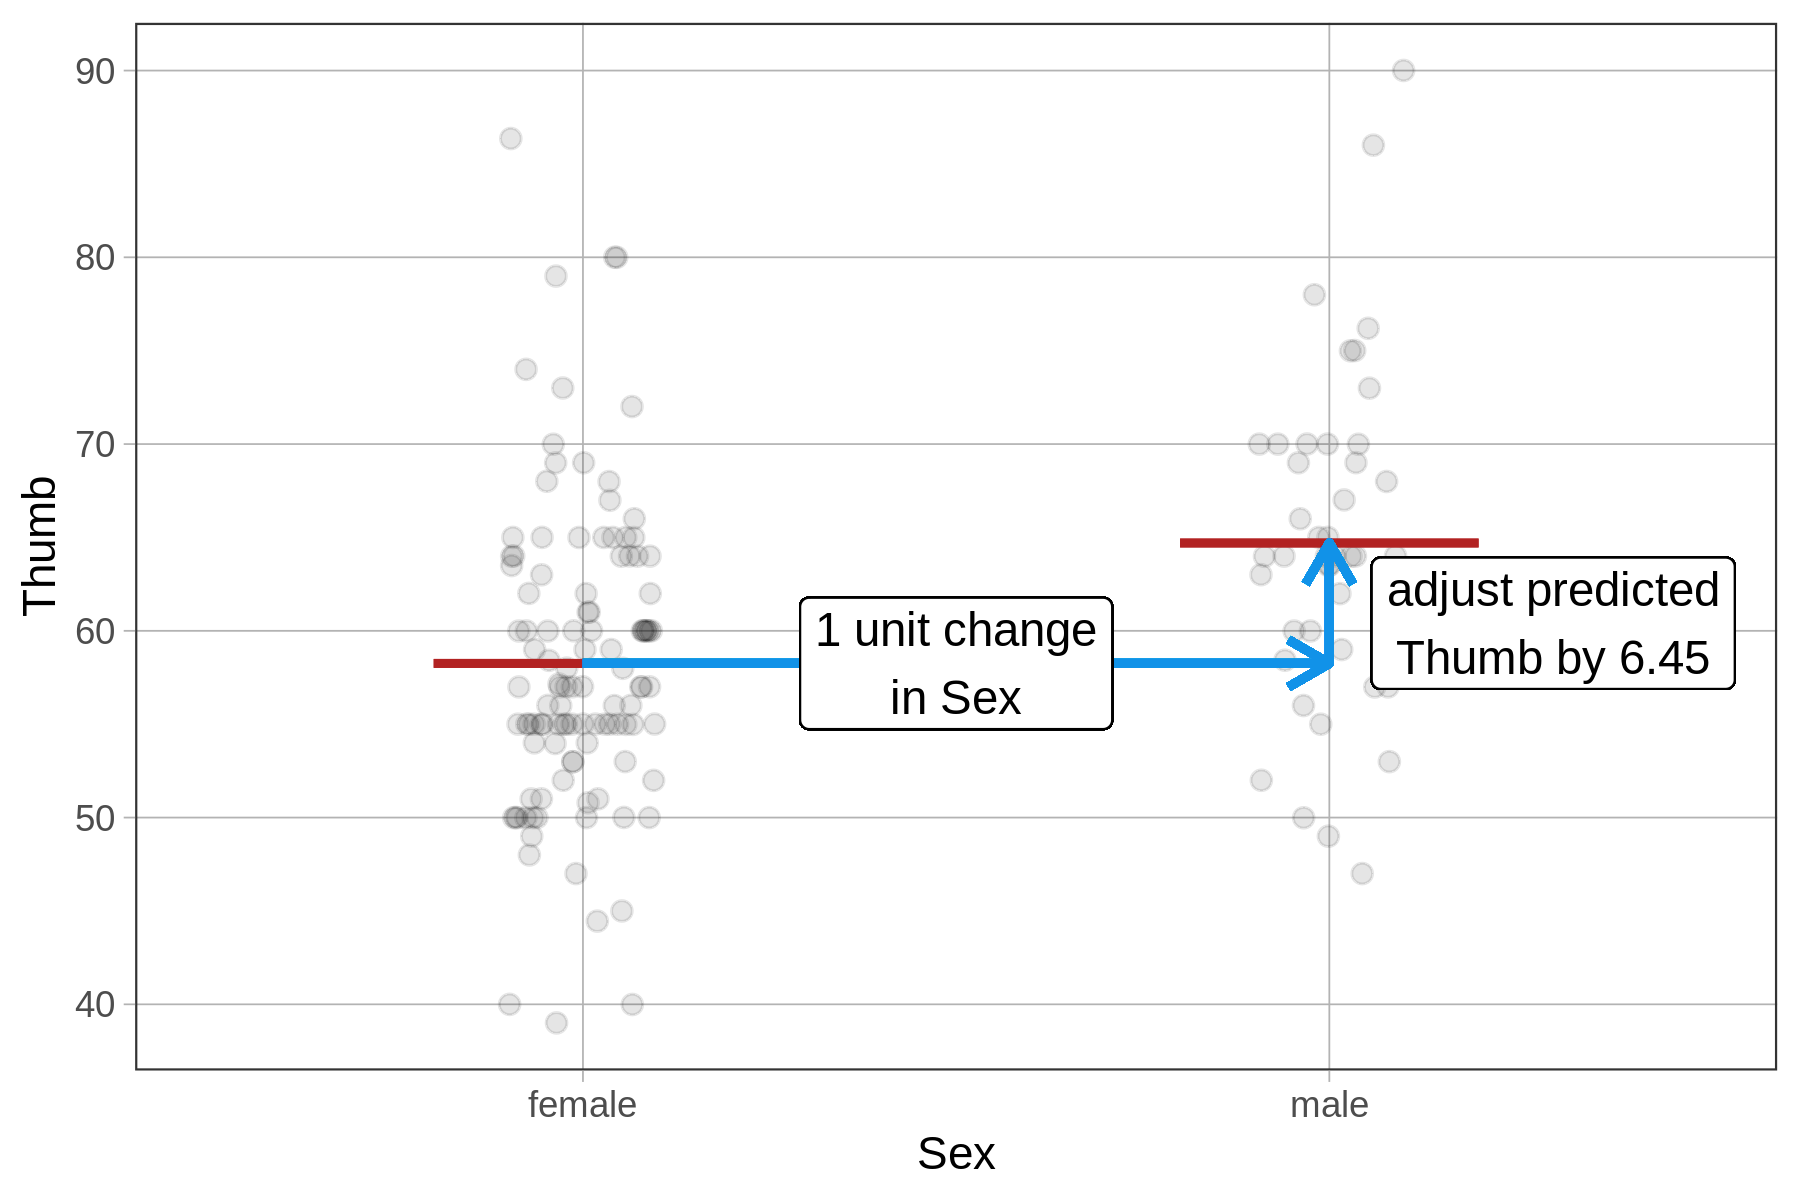
The \(b_1\) estimate will be the same as in the two-group model; because it represents the adjustment in thumb length for a one unit change in \(X_i\). For Sex, a 1-unit change is to go from not male (\(X_i=0\)) to male (\(X_i=1\)). For \(SexNum\), a 1-unit change similarly goes from not male (\(X_i=1\)) to male (\(X_i=2\)).
|
\(b_1\) of the \(Sex\) model, a group model |
\(b_1\) of the \(SexNum\) model, an accidental regression model |
|---|---|
|
|
|
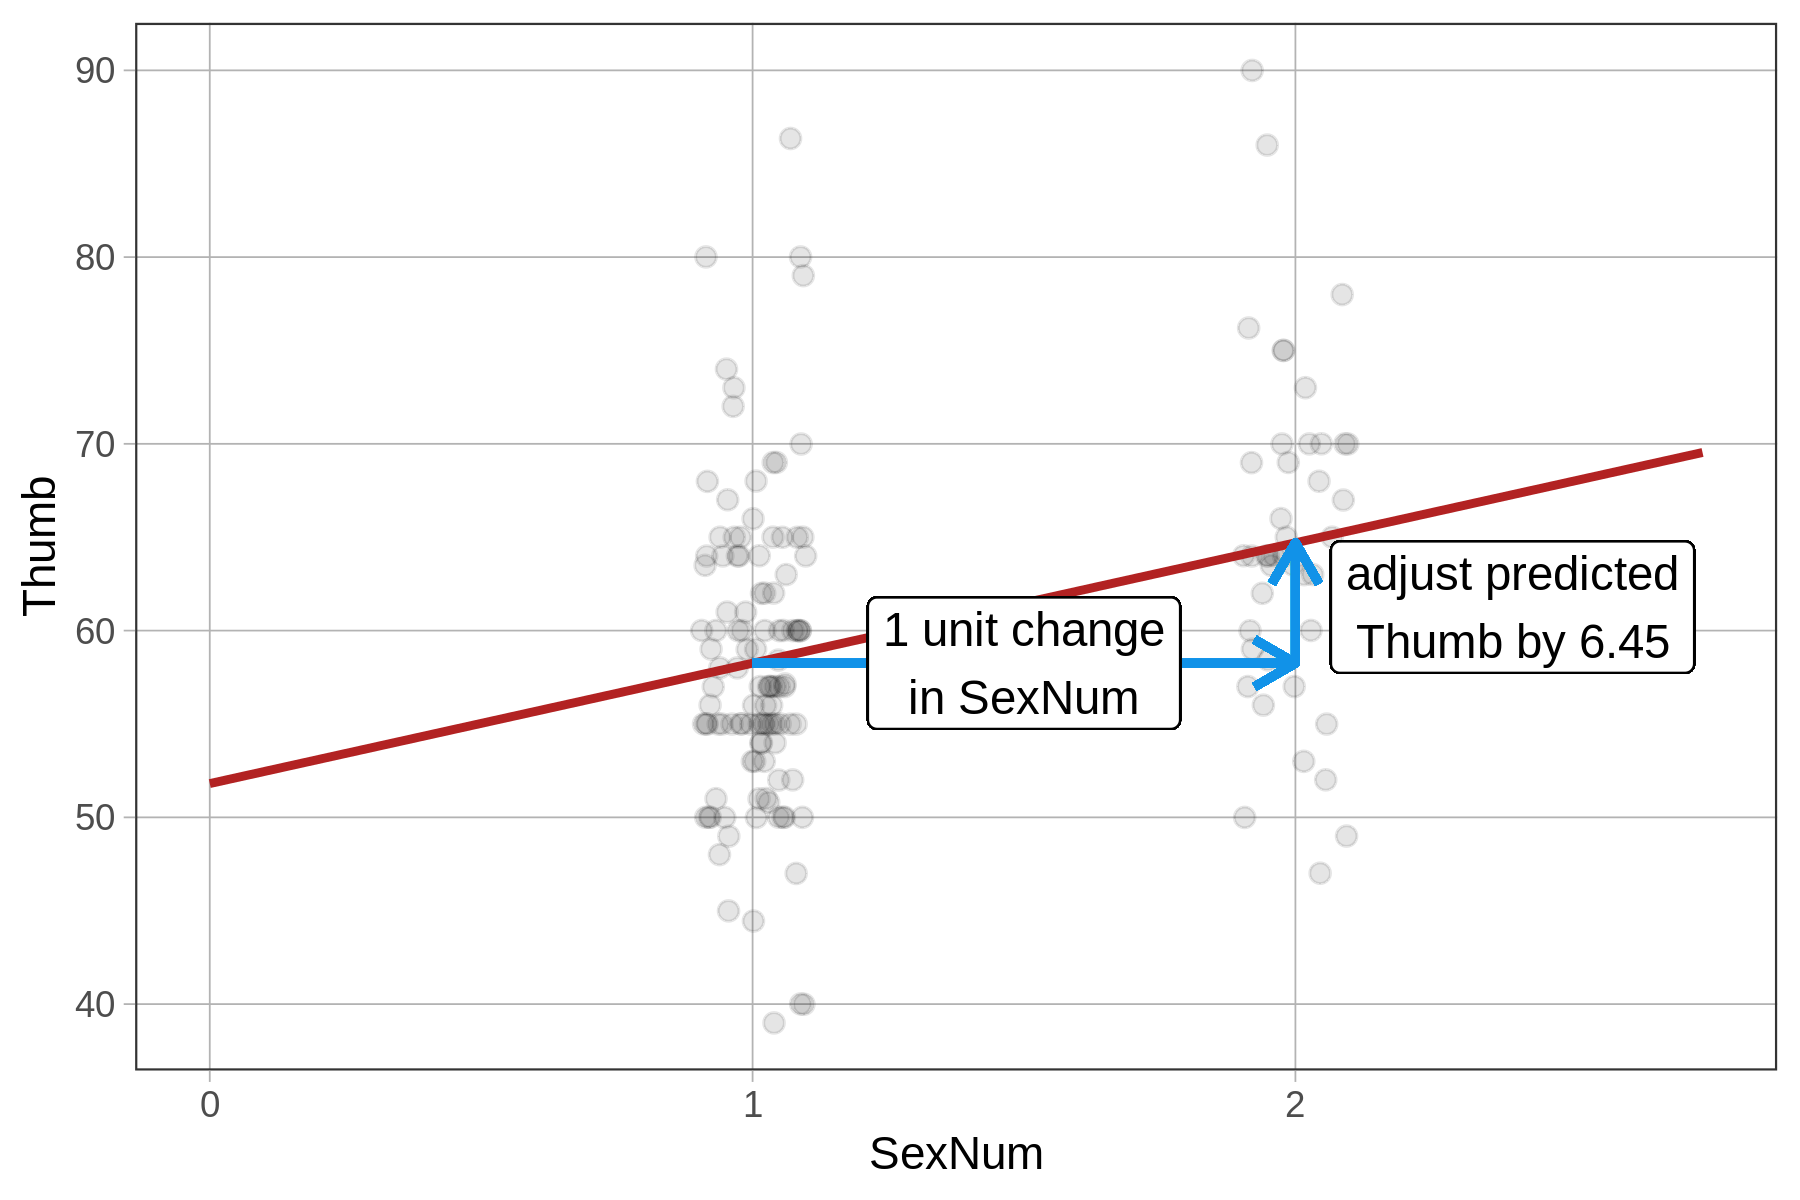
But the \(b_0\) estimate will be different in the SexNum model, where it represents the y-intercept of the regression line, or the predicted thumb length when \(X_i\) equals 0. This makes no sense, however, when there are only two groups and they are coded 1 and 2. This is an accidental regression model.
| \(b_0\) of the \(Sex\) model | \(b_\) of the \(SexNum\) model |
|---|---|
|
|
|