8 – Digging Deeper into Group Models
8.1 Extending to a Three-Group Model
You have now learned how to specify a model with a single categorical explanatory variable consisting of two groups. It’s actually pretty simple to extend this idea to a categorical variable with three groups.
First, a New Two-Group Model
Let’s use a new explanatory variable to explain variation in thumb length: Height. Height, in our data set, is a quantitative variable measured in inches. But we can make a new variable that turns Height into a categorical variable with two categories: short and tall.
We can do this using the ntile() function in R. The code below will cut the sample up into two equal-sized groups based on Height and save the result into a new variable called Height2Group.
Fingers$Height2Group <- ntile(Fingers$Height, 2)
head(select(Fingers, Thumb, Height, Height2Group), 10)
We used head() and select() to look at the first 10 rows of the relevant variables – Thumb, Height, and Height2Group:
   Thumb Height Height2Group
1  66.00   70.5            2
2  64.00   64.8            1
3  56.00   64.0            1
4  58.42   70.0            2
5  74.00   68.0            2
6  60.00   68.0            2
7  70.00   69.0            2
8  55.00   65.7            2
9  60.00   62.5            1
10 52.00   63.4            1
In the code window below, use the factor() function to add labels to Height2Group so that the 1s are labeled as short and the 2s are labeled as tall.
require(coursekata)

Fingers <- Fingers %>% mutate(
   Height2Group = ntile(Height, 2)
)
# this creates Height2Group, a numeric variable
Fingers$Height2Group <- ntile(Fingers$Height, 2)

# this is how we used factor() before:
Fingers$Sex <- factor(Fingers$Sex, levels = c(1,2), labels = c("female", "male"))

# modify this line so that 1s are labeled as "short" and 2s are labeled as "tall"
Fingers$Height2Group <- factor()

# this prints out 10 rows of Fingers for the selected columns
head(select(Fingers, Thumb, Height, Height2Group), 10)
Fingers$Height2Group <- factor(Fingers$Height2Group, levels = 1:2, labels = c("short", "tall"))

head(select(Fingers, Thumb, Height, Height2Group), 10)
ex() %>% {
   check_object(., "Fingers") %>% check_column("Height2Group") %>% check_equal()
   check_output_expr(., "head(select(Fingers, Thumb, Height, Height2Group), 10)")
} Thumb Height Height2Group
1 66.00 70.5 tall
2 64.00 64.8 short
3 56.00 64.0 short
4 58.42 70.0 tall
5 74.00 68.0 tall
6 60.00 68.0 tall
7 70.00 69.0 tall
8 55.00 65.7 tall
9 60.00 62.5 short
10 52.00 63.4 short Using the same approach we used for sex, we can write the model for Height2Group like this:
\[Thumb_i=b_0+b_1Height2Group_i+e_i\]
Go ahead and fit the Height2Group model, and print out the parameter estimates and ANOVA table for the model.
require(coursekata)

Fingers <- Fingers %>% mutate(
    Height2Group = factor(ntile(Height, 2), 1:2, c("short", "tall"))
)
# fit a model for Thumb ~ Height2Group
Height2Group_model <-

# this prints out the estimates
Height2Group_model
Height2Group_model <- lm(formula = Thumb ~ Height2Group, data = Fingers)
Height2Group_model
ex() %>% {
    check_function(., "lm") %>% check_arg("formula") %>% check_equal()
    check_object(., "Height2Group_model") %>% check_equal()
    check_output_expr(., "Height2Group_model")
}Call:
lm(formula = Thumb ~ Height2Group, data = Fingers)
Coefficients:
(Intercept) Height2Grouptall
57.818 4.601Analysis of Variance Table (Type III SS)
Model: Thumb ~ Height2Group
SS df MS F PRE p
----- --------------- | --------- --- ------- ------ ------ -----
Model (error reduced) | 830.880 1 830.880 11.656 0.0699 .0008
Error (from model) | 11049.331 155 71.286
----- --------------- | --------- --- ------- ------ ------ -----
Total (empty model) | 11880.211 156 76.155 A Three-Group Model
Now let’s try this same approach with three height groups: short, medium, and tall.
Revise the code below to make a new variable called Height3Group that divides the sample into three categories based on Height, each with an equal number of students. Label the levels (1,2,3) as short, medium, and tall.
require(coursekata)

Fingers <- Fingers %>% mutate(
    Height2Group = factor(ntile(Height, 2), 1:2, c("short", "tall"))
)
Height2Group.model <- lm(Thumb ~ Height2Group, data = Fingers)
# modify these two lines of code to create 3 Height groups with the labels "short", "medium", and "tall"
# make sure you save to a new variable in Fingers called Height3Group
Fingers$Height2Group <- ntile(Fingers$Height, 2)
Fingers$Height2Group <- factor(Fingers$Height2Group, levels = c(1,2), labels = c("short", "tall"))

# this prints out 10 rows of Fingers for selected columns
head(select(Fingers, Thumb, Height, Height3Group), 10)
Fingers$Height3Group <- ntile(Fingers$Height, 3)
Fingers$Height3Group <- factor(Fingers$Height3Group, levels = c(1,2,3), labels = c("short", "medium", "tall"))

head(select(Fingers, Thumb, Height, Height3Group), 10)
ex() %>% {
    check_object(., "Fingers") %>% check_column("Height3Group") %>% check_equal()
    check_output_expr(., "head(select(Fingers, Thumb, Height, Height3Group),10)")
} Thumb Height Height3Group
1 66.00 70.5 tall
2 64.00 64.8 medium
3 56.00 64.0 short
4 58.42 70.0 tall
5 74.00 68.0 tall
6 60.00 68.0 tall
7 70.00 69.0 tall
8 55.00 65.7 medium
9 60.00 62.5 short
10 52.00 63.4 short Calculate and print out the group means of Thumb for the three height groups.
require(coursekata)

Fingers <- Fingers %>% mutate(
    Height2Group = factor(ntile(Height, 2), 1:2, c("short", "tall")),
    Height3Group = factor(ntile(Height, 3), 1:3, c("short", "medium", "tall"))
)
Height2Group.model <- lm(Thumb ~ Height2Group, data = Fingers)
# use favstats() to print the group means of Thumb length for the three height groups you created earlier
favstats()
favstats(Thumb ~ Height3Group, data = Fingers)
ex() %>% check_function("favstats") %>% check_result() %>% check_equal() Height3Group min Q1 median Q3 max mean sd n missing
1 short 39.00 51.00 55 58.42 79.00 56.07113 7.499937 53 0
2 medium 45.00 55.00 60 64.00 86.36 60.22375 8.490406 52 0
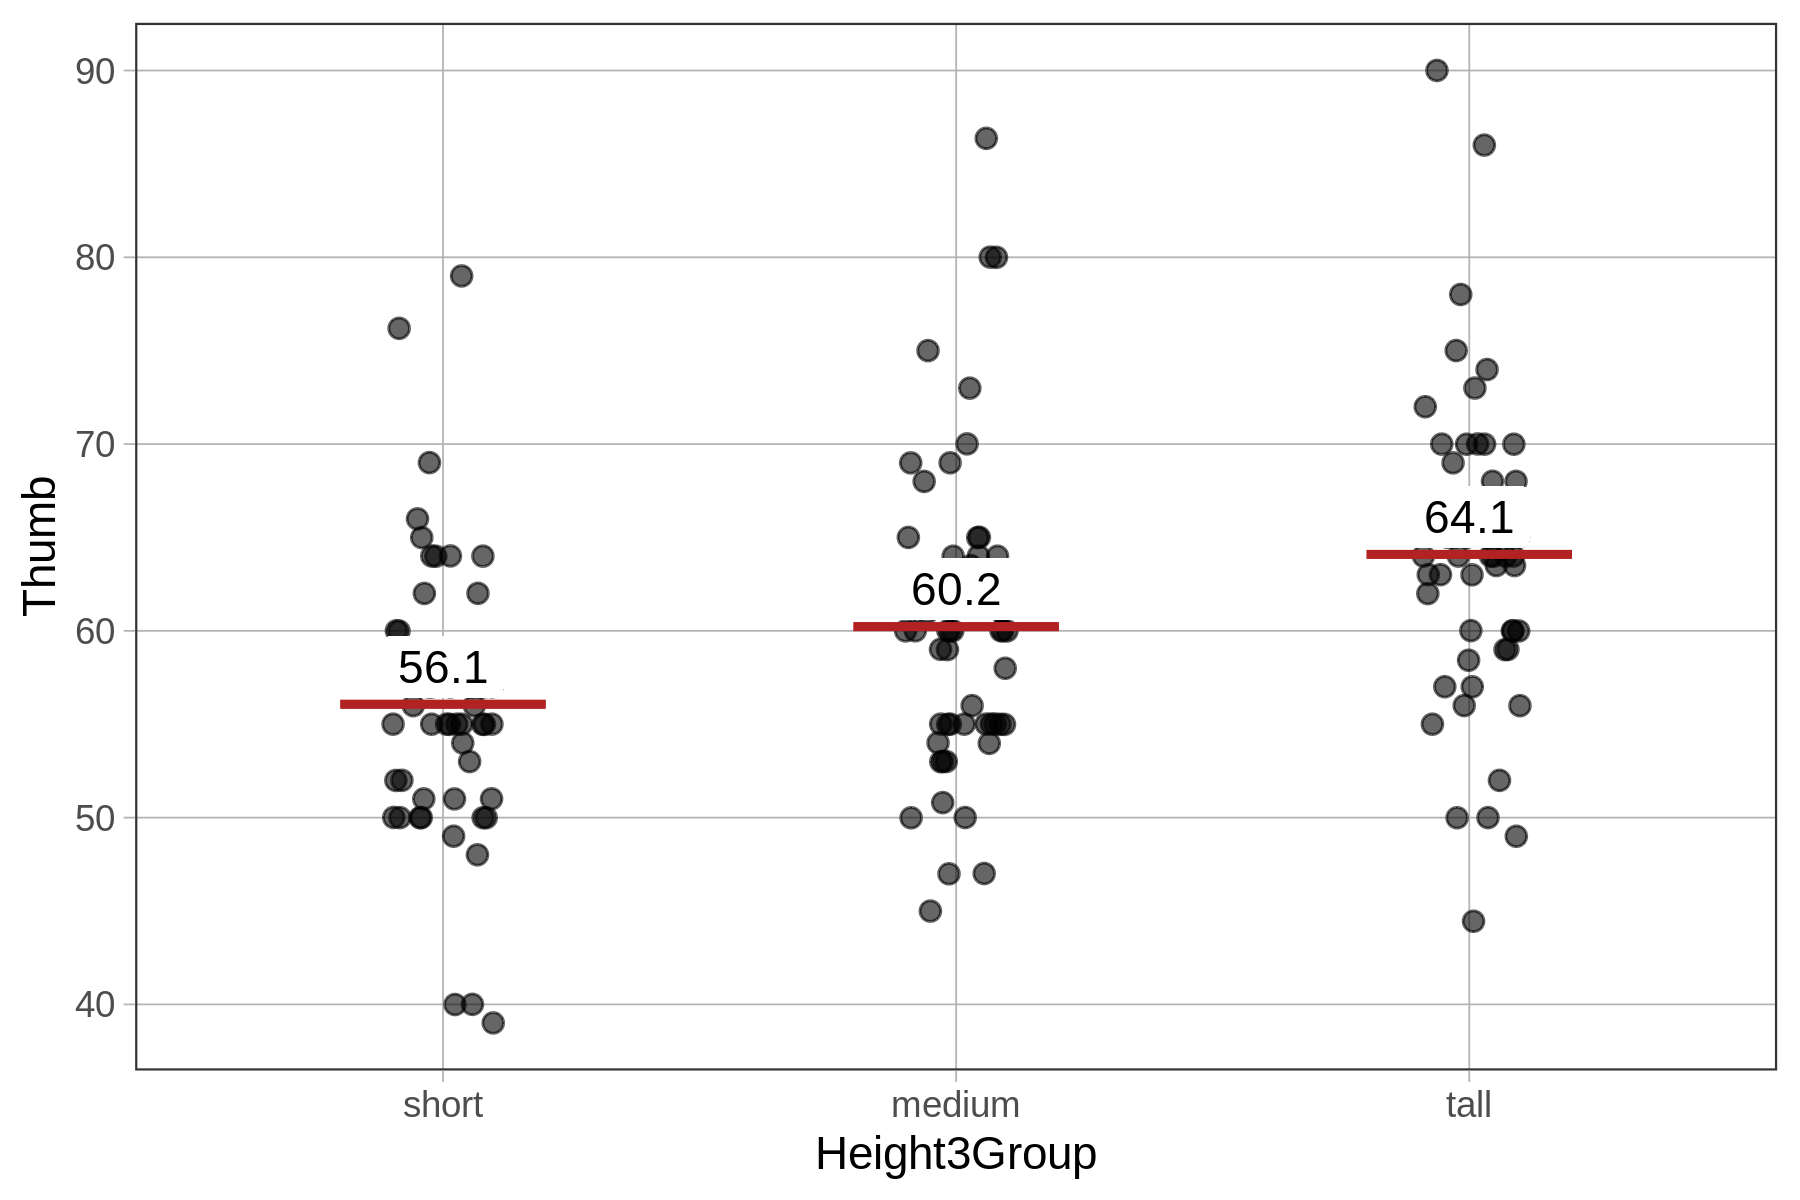
3 tall 44.45 59.75 64 68.25 90.00 64.09365 8.388113 52 0 Here is a jitter plot that shows the distribution of thumb lengths for each of the three height groups and the mean of each group. On the next page, we’ll learn how to create a model of thumb length based on the three height groups.