8.2 Fitting and Interpreting the Three-Group Model
We can now create a model that adjusts its predictions based on whether people are short, medium or tall (i.e., Height3Group). Let’s learn how to fit this model using R, and represent it in GLM notation.
Fitting the Height3Group Model
Now use the code window below to fit the Height3Group model to the data, and print out the model estimates.
require(coursekata)

Fingers <- Fingers %>% mutate(
    Height2Group = factor(ntile(Height, 2), 1:2, c("short", "tall")),
    Height3Group = factor(ntile(Height, 3), 1:3, c("short", "medium", "tall"))
)
Height2Group_model <- lm(Thumb ~ Height2Group, data = Fingers)
# modify this code to fit the model
Height3Group_model <- lm(Thumb ~ )

# this prints out the estimates
Height3Group_model
Height3Group_model <- lm(Thumb ~ Height3Group, data = Fingers)
Height3Group_model
ex() %>% {
    check_function(., "lm") %>% check_arg("formula") %>% check_equal()
    check_object(., "Height3Group_model") %>% check_equal()
    check_output_expr(., "Height3Group_model")
}Call:
lm(formula = Thumb ~ Height3Group, data = Fingers)
Coefficients:
(Intercept) Height3Groupmedium Height3Grouptall
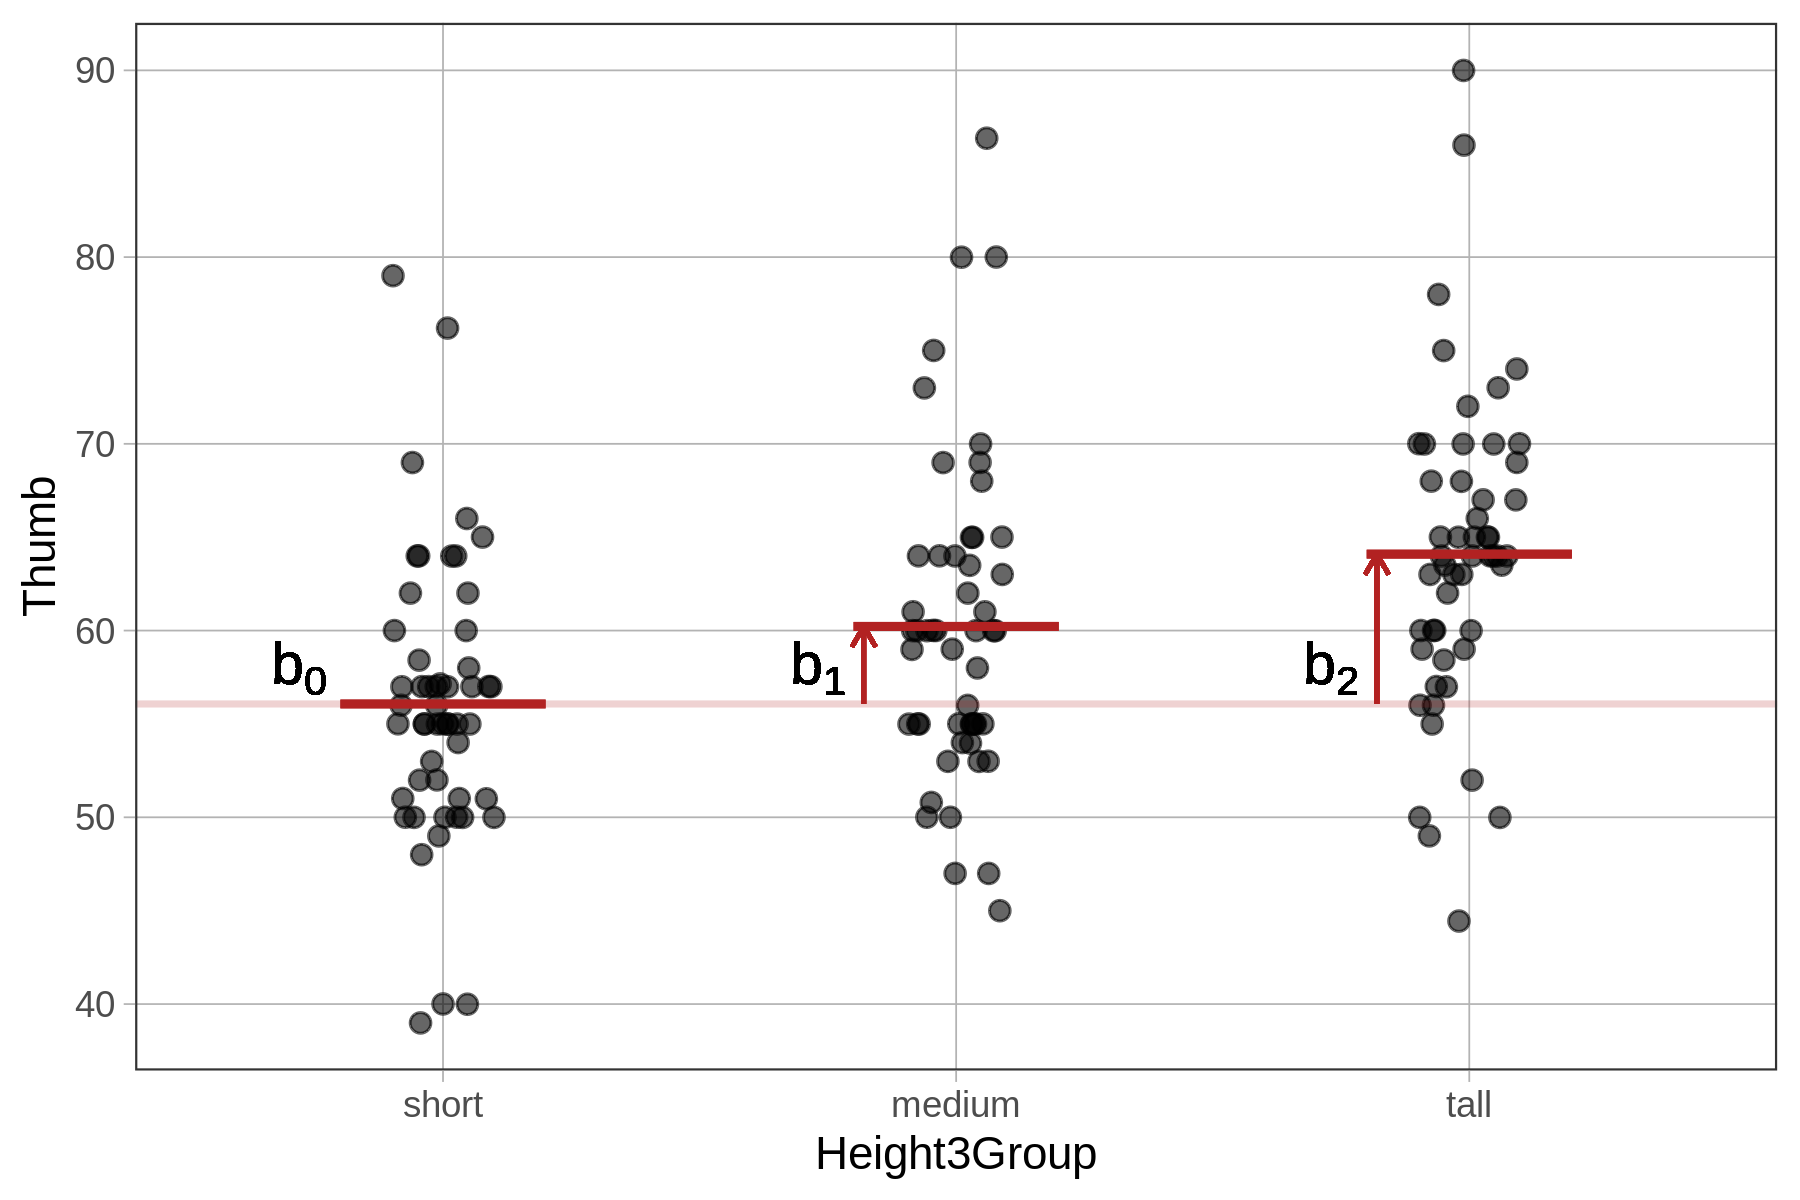
56.071 4.153 8.023 The three-group model is written like this using General Linear Model notation:
\[Y_i=b_0+b_1X_{1i}+b_2X_{2i}+e_i\]
Whereas fitting the two-group model involved constructing two parameter estimates (\(b_0\) and \(b_1\)), the three-group model adds a third parameter estimate (\(b_2\)).
Interpreting the Height3Group Model
\(b_0\) is the mean of the short group. \(b_1\) is the increment you have to add to the short group to get the mean of the medium group. And \(b_2\) is the increment you have to add to the short group to get the mean of the tall group.
We can substitute in the parameter estimates into the model, like this:
\(Y_i=56.07+4.15X_{1i}+8.02X_{2i}+e_i\); or, more specifically, like this:
\[\text{Thumb}_i=56.07+4.15\text{Height3Groupmedium}_i+8.02\text{Height3Grouptall}_i+e_i\]
Just as before, it is useful to think through exactly how the X variables are coded. Notice, first, that we now have two of these in the model: \(X_{1i}\) and \(X_{2i}\). The new subscripts (1 and 2) just distinguish between the two variables; instead of giving them different names, we call them X-sub-1 and X-sub-2.
The sub-i indicates these are not parameters, but variables, which means that each individual in the data set will have their own scores on the two variables. As before, it’s a little tricky to figure out what all the possible scores are on these two variables, and also how scores are assigned for each individual.
R doesn’t necessarily use the same numbers you do to code a variable. For the Height3Group model we put in a single categorical explanatory variable (Height3Group, with level 1 representing short, 2 representing medium, and 3 representing tall). But R turns this one variable into two new variables, \(X_1\) and \(X_2\), both of which are dummy coded, which means they can either have a value of 0 or 1 for each person in the data set.
Here’s how dummy coding works: For someone in the short group, the model needs to assign them a score of 56.07, the mean for the short group. You can think of \(X_1\) as a variable asking, “Is this person medium?” and 0 means no and 1 means yes. By the same reasoning, \(X_2\) represents whether someone is tall or not. For short people, \(X_1\) and \(X_2\) are both 0 because they are not medium and not tall.
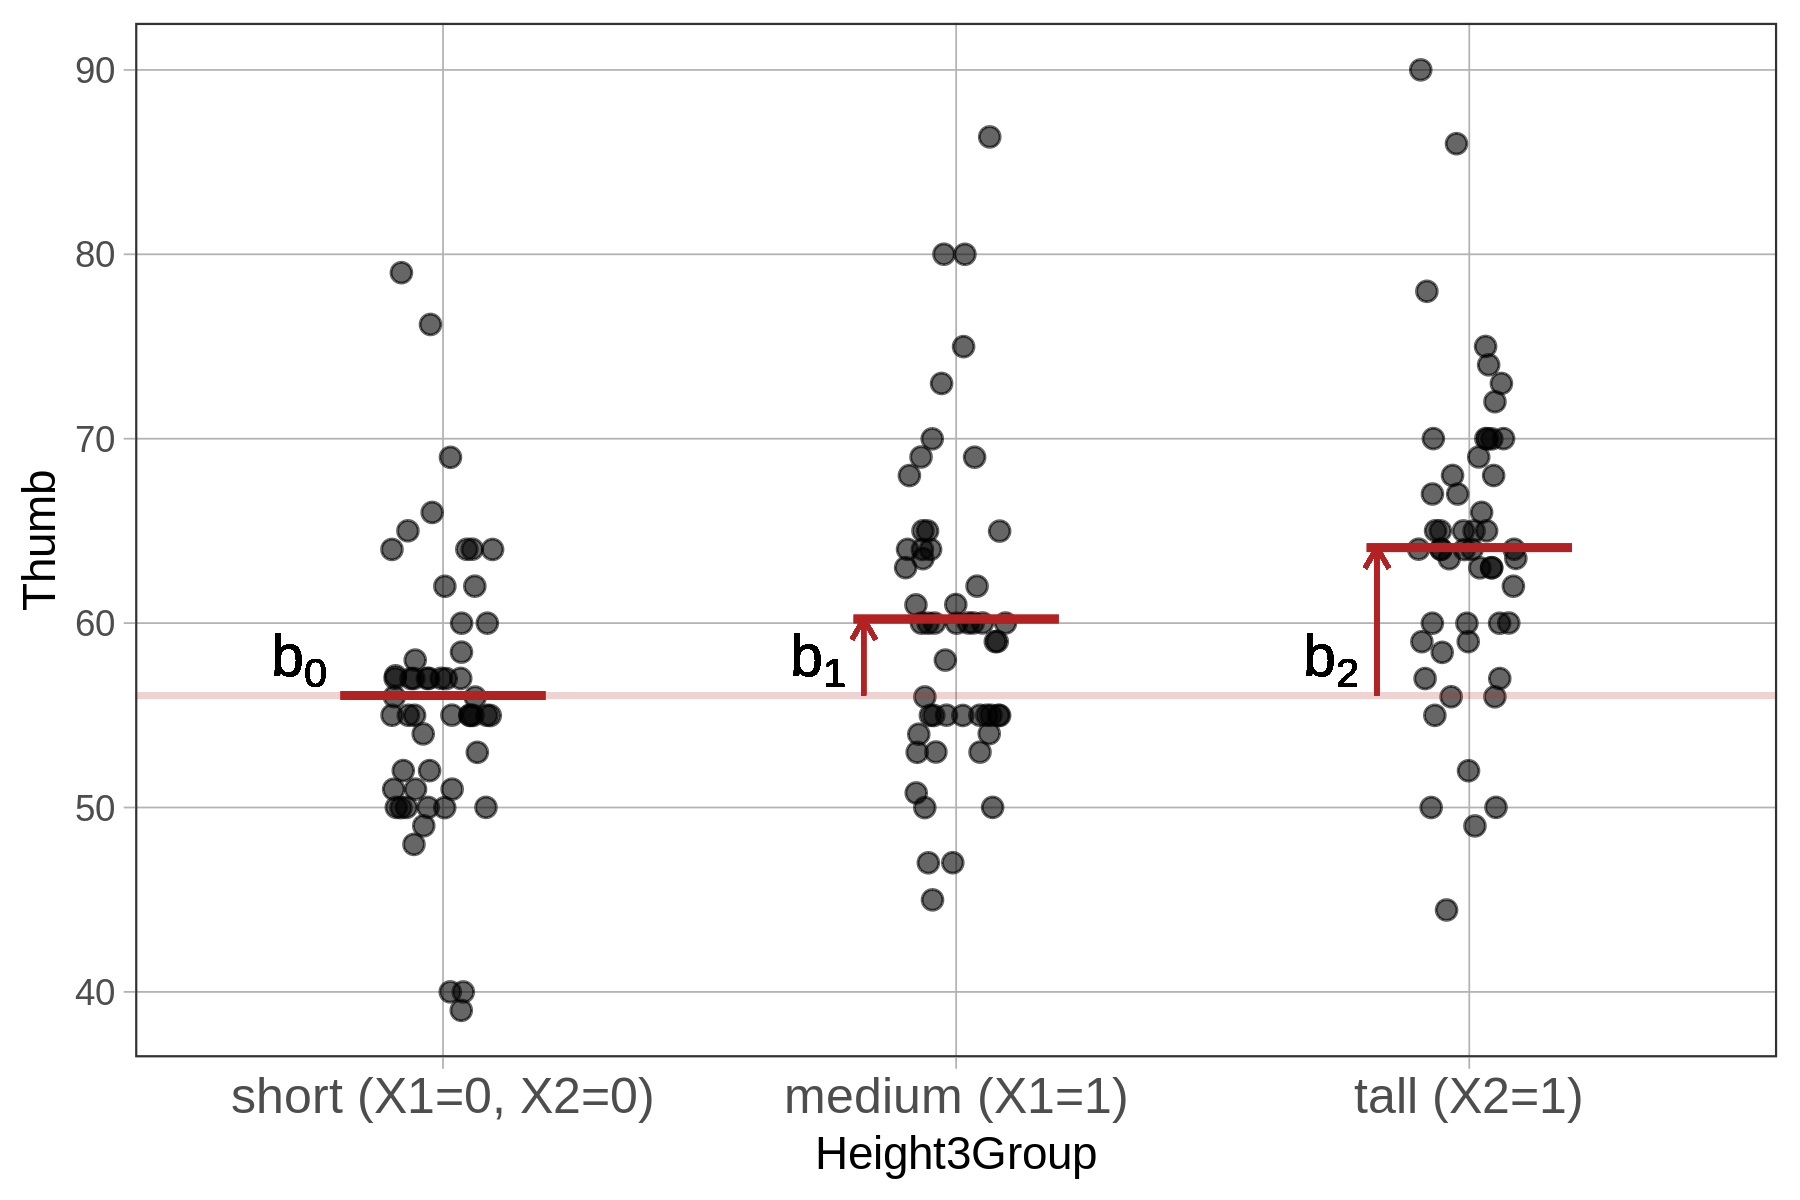
For the people in the medium group, \(X_1\) should be 1 (because they are in the medium group), and \(X_2\) should be 0 (because they are not in the tall group). So the model will give them a predicted thumb length of \(b_0 + b_1\) (56.07 + 4.15) which is equal to 60.22 mm.
And notice from favstats that the average thumb length of the medium group is 60.22!
  Height3Group   min    Q1 median    Q3   max     mean      sd  n missing
1        short 39.00 51.00     55 58.42 79.00 56.07113 7.499937 53       0
2       medium 45.00 55.00     60 64.00 86.36 60.22375 8.490406 52       0
3         tall 44.45 59.75     64 68.25 90.00 64.09365 8.388113 52       0
Dummy coding takes categorical variables and turns them into a series of binary codes. As you can see from the table below, just giving each person a 0 or 1 on \(X_1\) and \(X_2\) can uniquely categorize them as short, medium, or tall.
| Category (Group) | \(X_1\) Code | \(X_2\) Code |
|---|---|---|
| Short | 0 | 0 |
| Medium | 1 | 0 |
| Tall | 0 | 1 |
You may wonder why you need to go through all the details of how R assigns dummy codes for the categorical explanatory variable. The reason is that it gives you a concrete understanding of how to interpret the model parameters. For example, it helps us understand how the model generates the third group’s prediction, by adding \(b_2\) to \(b_0\) (and not to \(b_1\)). In this course, we don’t often ask you to calculate these numbers on your own. Instead, we want you to focus on thinking about what, exactly, a number means.