9.5 Making Parameter Estimates More Meaningful in Interaction Models
In both additive and interaction models, the parameter estimate for a variable represents the effect of that variable when the other variables in the model are equal to 0. As we will see, this fact has different implications for an additive model than it does for the interaction model.
Let’s look again at the additive model (and it’s best-fitting parameter estimates):
\[\text{later}_i \hspace{5pt}=\hspace{5pt} b_0 \hspace{5pt}+\hspace{5pt} b_1\text{Dog}_i \hspace{5pt}+\hspace{5pt} b_2\text{base}_i \hspace{5pt}+\hspace{5pt} e_i\]
\[\text{later}_i=0.43+-2.03\text{Dog}_i+0.81\text{base}_i + e_i\]
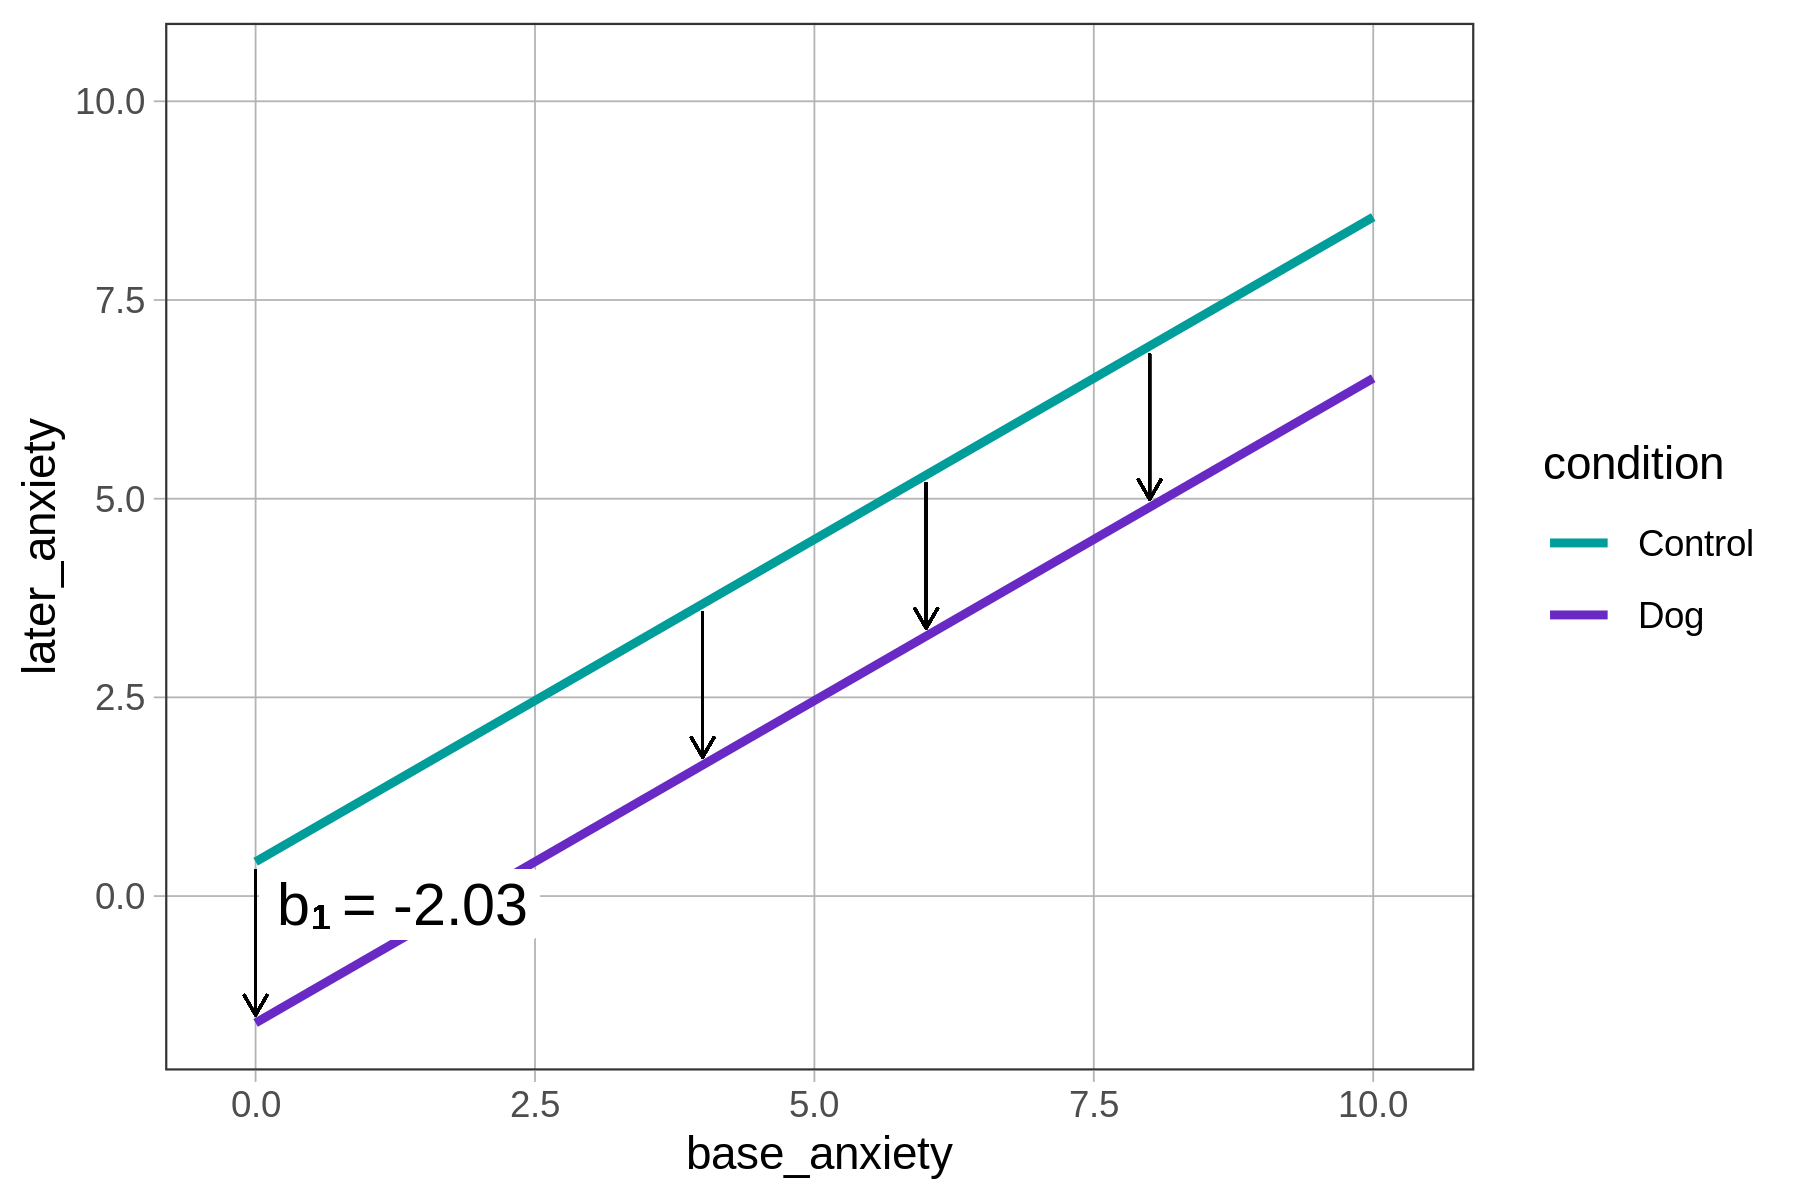
Because it is an additive model with no interaction, you don’t need to keep reminding yourself that the estimates are for the point at which the other variables are equal to 0. It doesn’t really matter: the effect of being in the dog group is a decrease of 2.03 points in anxiety, and this decrease is the same at all points along the later_anxiety by base_anxiety regression line.
You can see this in the graph on the left side of the figure below: the difference between the two conditions, represented by the vertical arrows showing the difference between the two regression lines, is the same across all levels of base_anxiety. The fact that almost no one has a base anxiety of 0 is not important for the additive model: the \(b_1\) estimate represents the group difference up and down the base anxiety scale.
|
Best-Fitting Additive Model \(0.43+-2.03\text{Dog}_i+0.81\text{base}_i\) |
Best-Fitting Interaction Model \(-0.35 + -0.64\text{Dog}_i + 0.94\text{base}_i + -0.23\text{Dog}_i*\text{base}_i\) |
|---|---|
|
|
|
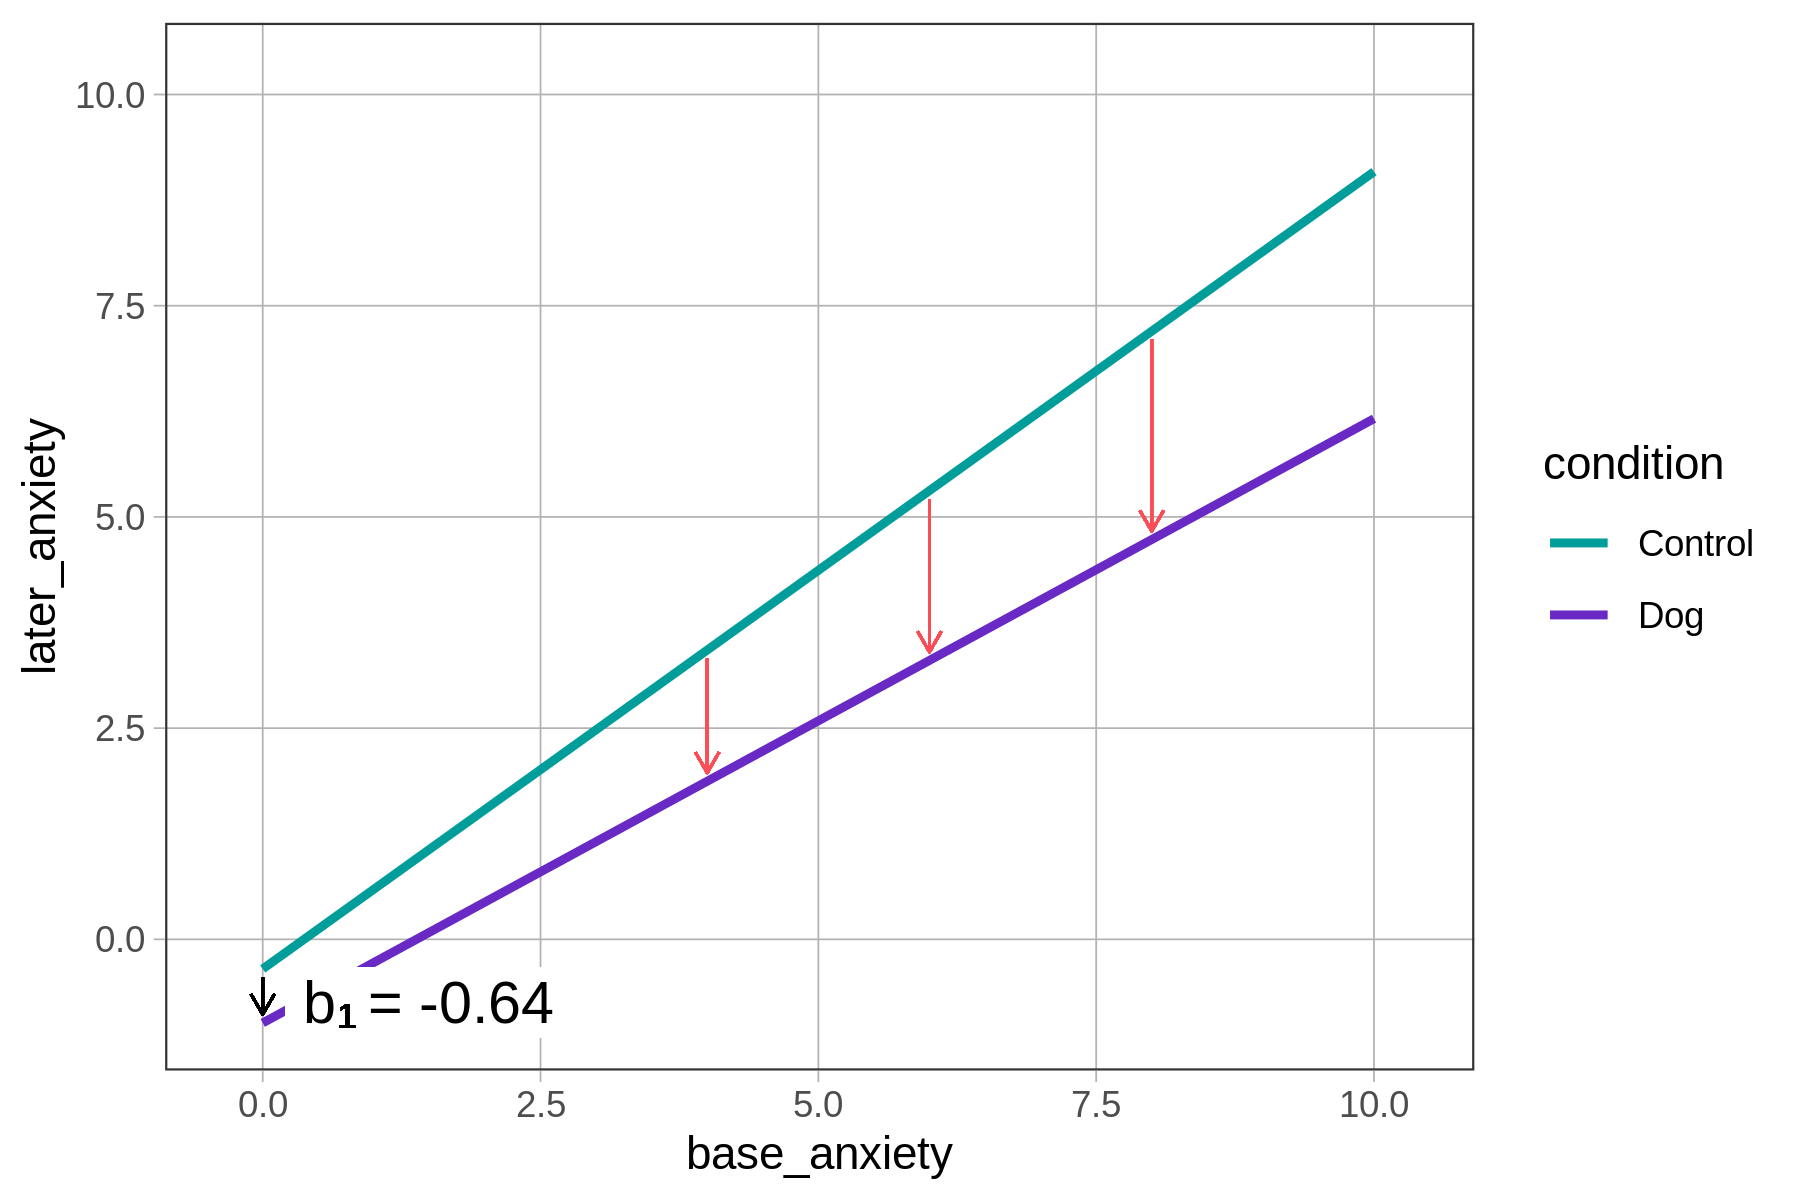
In the interaction model (shown in the graph on the right), the interpretation of the \(b_1\) estimate is not so straightforward. At first glance, it appears that the effect of being in the dog condition has gotten smaller, going from a decrease of 2.03 points in later anxiety to a decrease of only 0.64 points. But we must remember: -0.64 is the estimate of \(b_1\) only for patients whose base anxiety is 0, which is almost no one.
As shown in the graph on the right (above), the interaction model’s prediction of the effect of being in the dog condition grows larger as base_anxiety goes up. You can see this by comparing the lengths of the red arrows as base anxiety goes up. In fact, this is exactly what you would expect in an interaction model: the effect of one variable (in this case, the effect of being in the dog group) is different at different levels of another variable (in this case, base anxiety).
Thus, whereas you can summarize the additive model by saying, “The effect of being in the dog group is a 2-point reduction in anxiety,” no such summary is possible in the interaction model. If the DGP is best represented by the interaction model, all you can say is, “It depends.” The effect of being in the dog group depends on one’s level of anxiety when first arriving at the emergency room.
Making the 0 Point More Meaningful
If the parameter estimate for conditionDog is the effect of being in the dog group when base anxiety is 0; and if base anxiety being 0 is either rare or meaningless; why not try to change the variable base_anxiety so that 0 is more meaningful?
Sound crazy? It’s not! In fact, data analysts will often transform the scale of a quantitative predictor variable so that it is centered at 0 just to make the parameter estimates for other variables more meaningful. This is often referred to as “centering the predictor.”
In the current case, if base_anxiety were transformed so that 0 was the mean of the variable, then the parameter estimate for being in the dog condition (\(b_1\)) could be interpreted as the effect of being in the dog group for someone with average base anxiety.