9.6 Sums of Squares in the ANOVA Table
Finally, let’s use the ANOVA table to examine the fit of the height model. We have saved Height_model in the code block below. Use supernova() to generate the ANOVA table.
require(coursekata)
# this saves the Height_model
Height_model <- lm(Thumb ~ Height, data = Fingers)

# print the ANOVA tables for this model
# this saves the Height_model
Height_model <- lm(Thumb ~ Height, data = Fingers)

# print the ANOVA tables for this model
supernova(Height_model)
ex() %>%
  check_function("supernova") %>%
  check_result() %>%
check_equal()Below we have printed out the resulting ANOVA table for the Height_model along with the one we produced earlier for the Height2Group_model.
Height Model
Analysis of Variance Table (Type III SS)
Model: Thumb ~ Height

                               SS  df       MS      F    PRE     p
----- --------------- | --------- --- -------- ------ ------ -----
Model (error reduced) |  1816.862   1 1816.862 27.984 0.1529 .0000
Error (from model)    | 10063.349 155   64.925
----- --------------- | --------- --- -------- ------ ------ -----
Total (empty model)   | 11880.211 156   76.155
Height2Group Model
Analysis of Variance Table (Type III SS)
Model: Thumb ~ Height2Group
SS df MS F PRE p
----- --------------- | --------- --- ------- ------ ------ -----
Model (error reduced) | 830.880 1 830.880 11.656 0.0699 .0008
Error (from model) | 11049.331 155 71.286
----- --------------- | --------- --- ------- ------ ------ -----
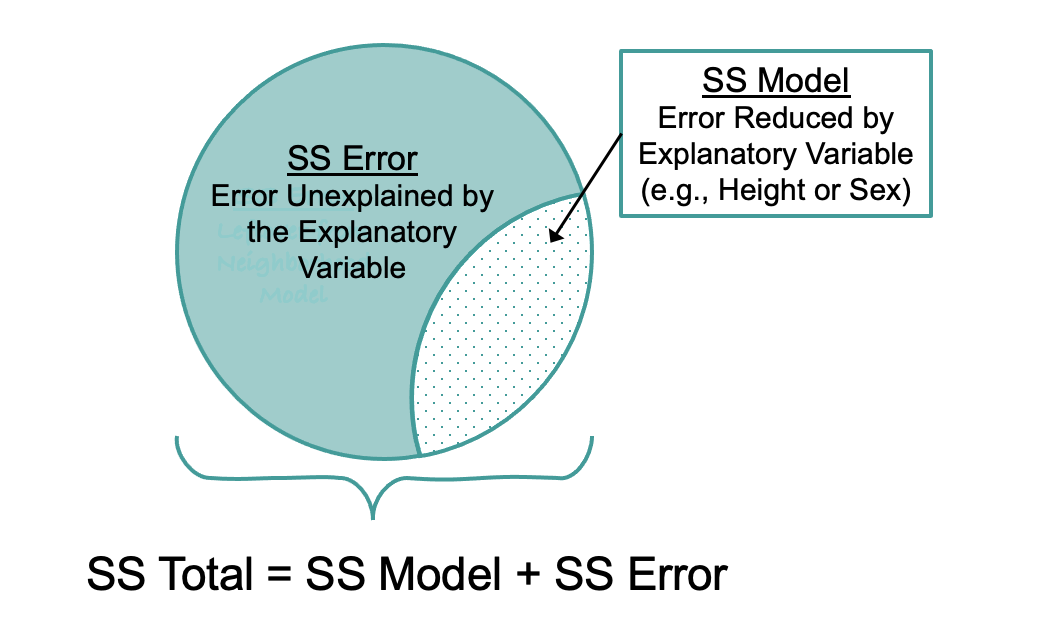
Total (empty model) | 11880.211 156 76.155 SS Total is the sum of squared residuals from the empty model. Total sum of squares is only about the outcome variable, and isn’t affected by the explanatory variable or variables. When we use sum of squares to compare statistical models, we are modeling the same outcome variable.
SS Error from Three Models
The table below summarizes the sums of squares leftover (SS Error) after fitting each of the three models we have been considering. All of these are calculated the same way, by summing the squared residuals from the model predictions.
| Model | Leftover SS | Statistic Name |
|---|---|---|
| Empty model | 11,880 | Sum of Squares Total (SST) |
Height2Group model
|
11,049 | Sum of Squares Error (SSE) |
Height model
|
10,063 | Sum of Squares Error (SSE) |
The more error there is leftover after fitting a model, the less of the total variation is explained. The empty model tells us how much total variation there is in the outcome variable. SS Error tells us how much of that error remains unexplained after fitting a more complex model.
SS Model
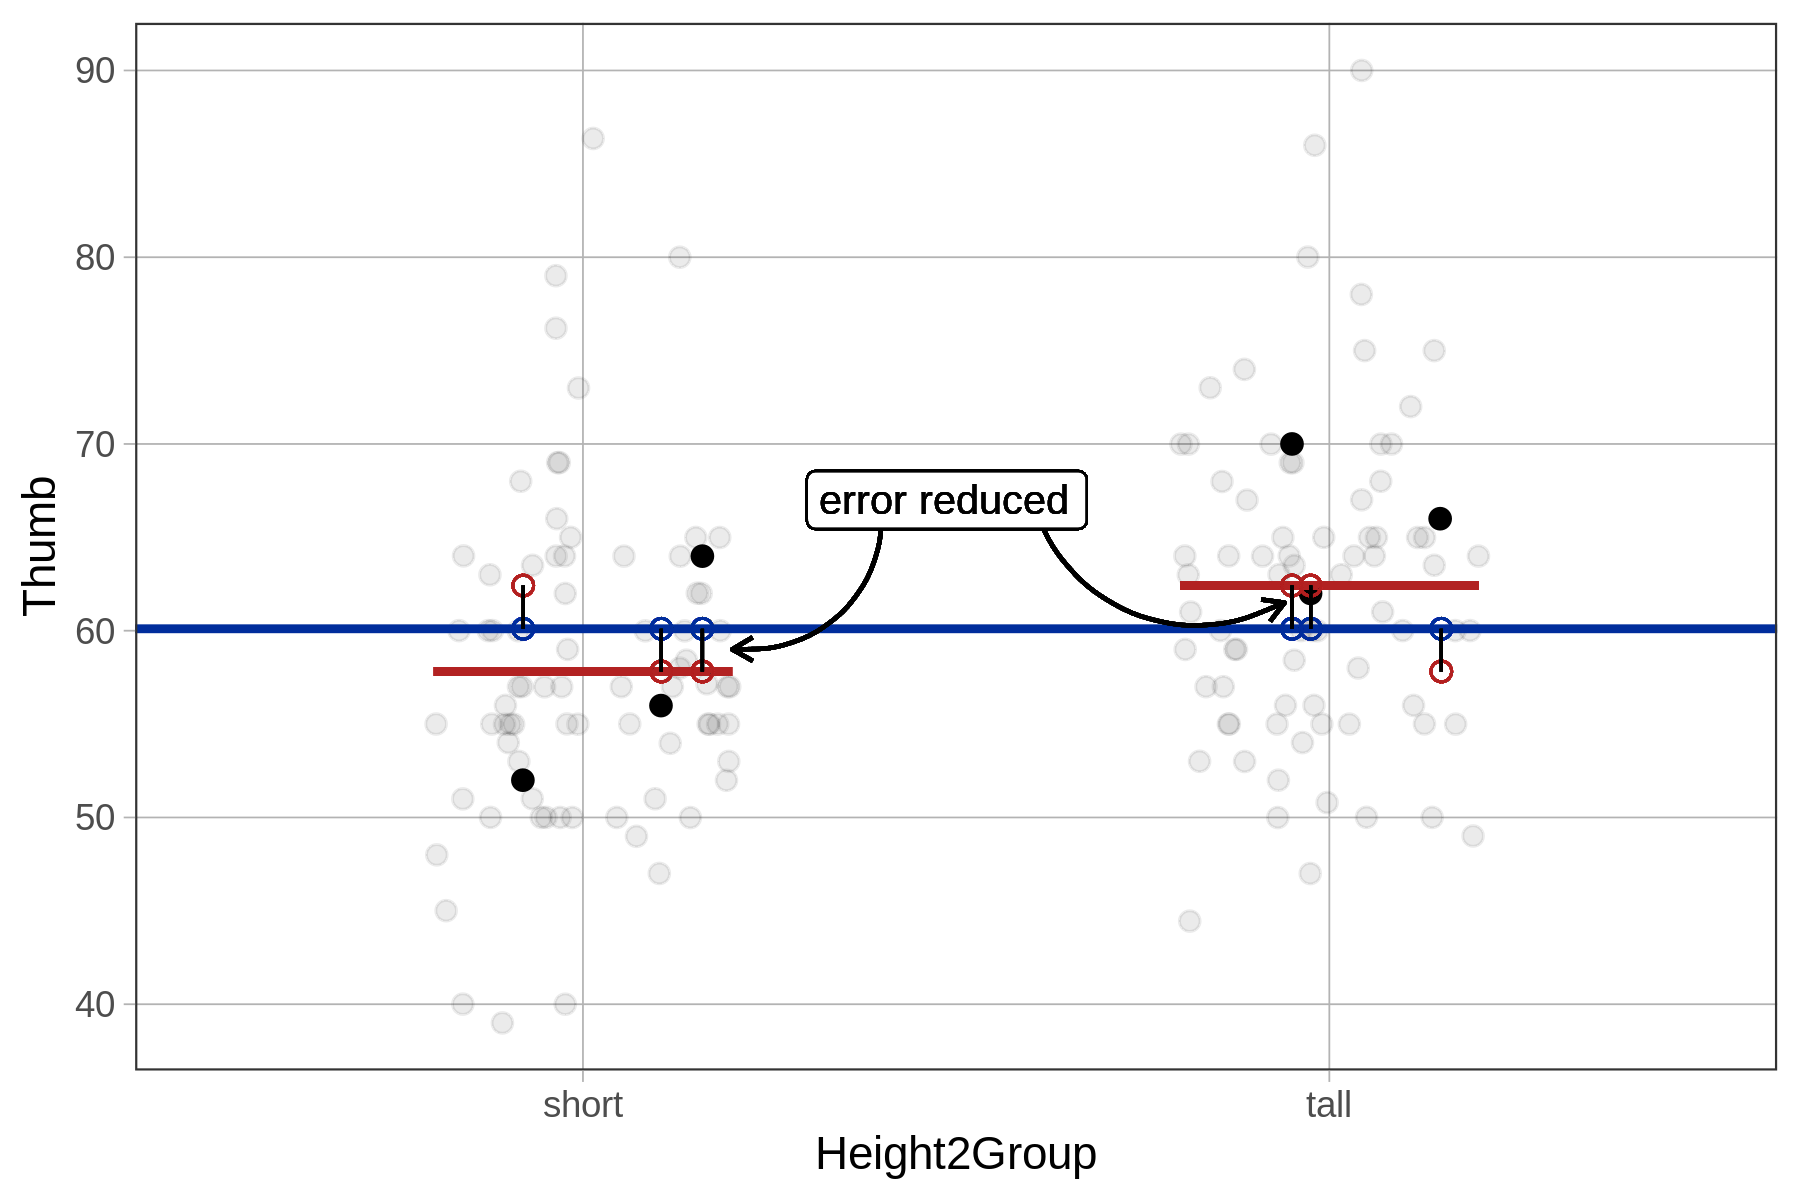
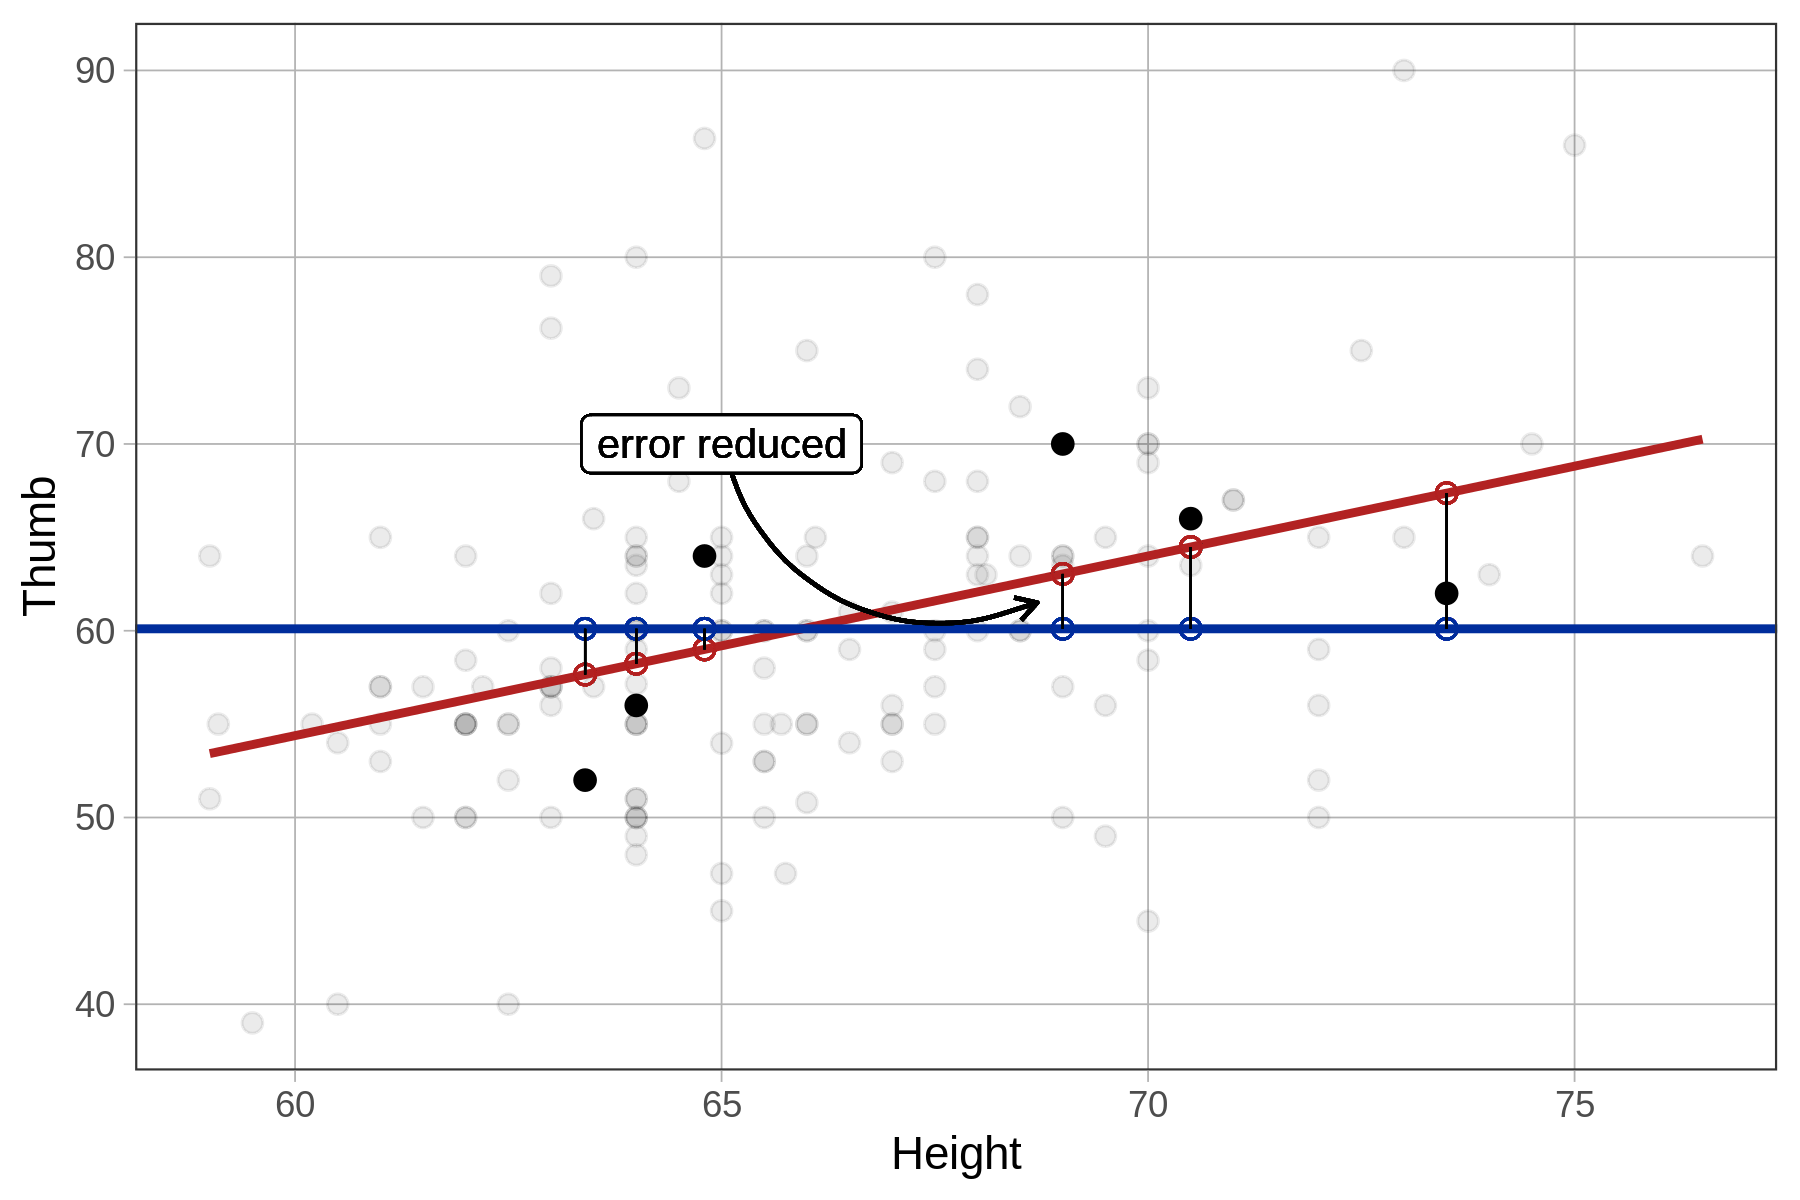
SS Model is the amount by which the error is reduced under the complex model (e.g., the Height model) compared with the empty model. As developed previously for group models, SS Model is easily calculated by subtracting SS Error from SS Total. This is the same, regardless of whether you are fitting a group model or a regression model.
It also is possible to calculate SS Model in the regression model directly, in much the same way we did for the group model. We simply take each person’s predicted score under the regression model and calculate its distance from the prediction of the empty model. This is the amount by which the model has reduced each person’s error compared with the empty model. We then square these distances and add them up to get SS Model.
Height2Group model’s error reduced
|
Height model’s error reduced
|
|---|---|
|
|
|