Chapter 3 - Examining Distributions
3.1 The Concept of Distribution
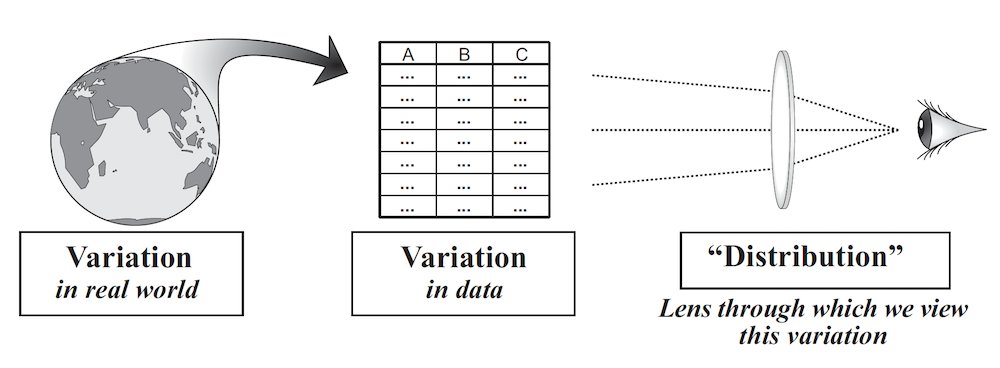
Assuming we have a tidy data set to work with, the next step in data analysis is to begin looking at the variation in your measures. This leads us to one of the most fundamental concepts in statistics, the concept of distribution. Wild (2006) defines the concept of distribution as “the pattern of variation in a variable or set of variables” and it is like a “lens” through which we can view variation in data (figure from Wild, C. (2006).)
The concept of distribution is complex; most people do not understand it all at once. If you find it difficult or vague, don’t worry. Just know, for now, that it will be a major concept throughout this course, and we will keep adding more dimensions to it as we progress.
Thinking about distributions requires you to think abstractly, at a higher level, about your data. You must shift your thinking from a focus on the individual observations in your data set (e.g., the 20 people you have sampled) to a focus—first, on just one attribute along which the observations vary; and second, to a focus on the pattern of variation in the attribute across the sample.
Note that not just any bunch of numbers can be thought of as a distribution. The numbers must all be measures of the same attribute. So, for example, if you have measures of height and weight on a sample of 20 people, you can’t just lump the height and weight numbers into a single distribution. You can, however, examine the distribution of height and the distribution of weight separately.
Data are inherently complex; even a small data set includes lots of numbers and lots of variation. By using the concept of distribution, we can begin to see all this variation as characteristic of a single thing: a distribution. The concept of distribution allows us to see the whole as greater than the sum of the parts; the forest, and not just the trees.
The features of a forest cannot be seen in a single tree. For example, measuring the height of a single tree does not allow you to see characteristics of the distribution of height. You can know the height of that one tree, but not the minimum, maximum, or average height of trees in the forest based on a single measurement. Statistics such as the mean do not themselves constitute a distribution; they are features of a distribution, features that don’t apply to individual trees.